.svg)
Sep-2026
Sales
Trend
6-Month
Product Count
SKUs
Avg Price
YoY Sales Change
YoY Price Change


Where to Buy
Pro Gro is stocked at 303 licensed dispensaries across Michigan and Washington, 302 of them in Michigan, with the deepest coverage in New Buffalo, Detroit, Monroe, Grand Rapids, and Kalamazoo. Search by ZIP code or city below to find the closest one, or filter by product type if you are after a specific format.
Market Insights Snapshot
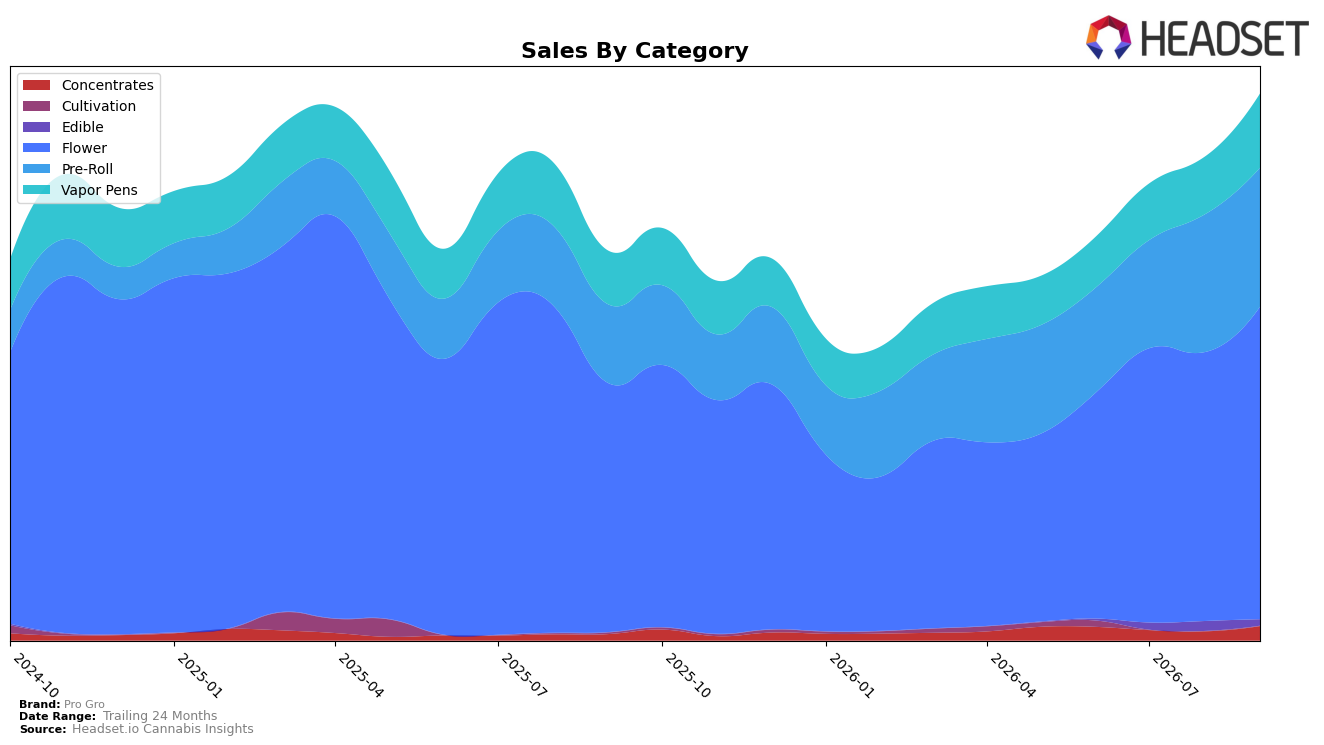
Pro Gro concentrated revenue in Flower at 57.28% share with 25.54% YoY growth and 16.23% MoM, while Pre-Roll held 25.43% share with 76.88% YoY and 0.92% MoM. Vapor Pens contributed 13.57% share with 38.46% YoY and 28.91% MoM, and Concentrates, though just 2.61% share, rose 127.97% YoY and 58.57% MoM; Edible slipped to 1.12% share with a -36.16% MoM change. The brand’s overall sales grew 40.96% YoY in September 2026 as average price declined 19.20% YoY to $11.54, and within the lead category Pro Gro sits at rank 3 in Flower in Michigan; the pattern implies volume-led expansion anchored by Flower, with incremental momentum from Vapor Pens and Concentrates offsetting an Edible retreat.
The mix shift toward value-accessible formats is visible in the 19.20% YoY price compression alongside Pre-Roll’s 25.43% share and 76.88% YoY growth, while the 58.57% MoM surge in Concentrates and 28.91% MoM in Vapor Pens point to faster-growing inhalable adjacencies complementing Flower’s 16.23% MoM baseline. Holding rank 3 in Michigan Flower amid a 25.54% YoY category gain suggests defensible core demand, and the combined 39.00%+ of sales from Pre-Roll and Vapor Pens implies a positioning that leans into quick-turn, lower-ticket throughput to drive share capture as price elasticity favors trade-down and cross-format trial.
Competitive Landscape
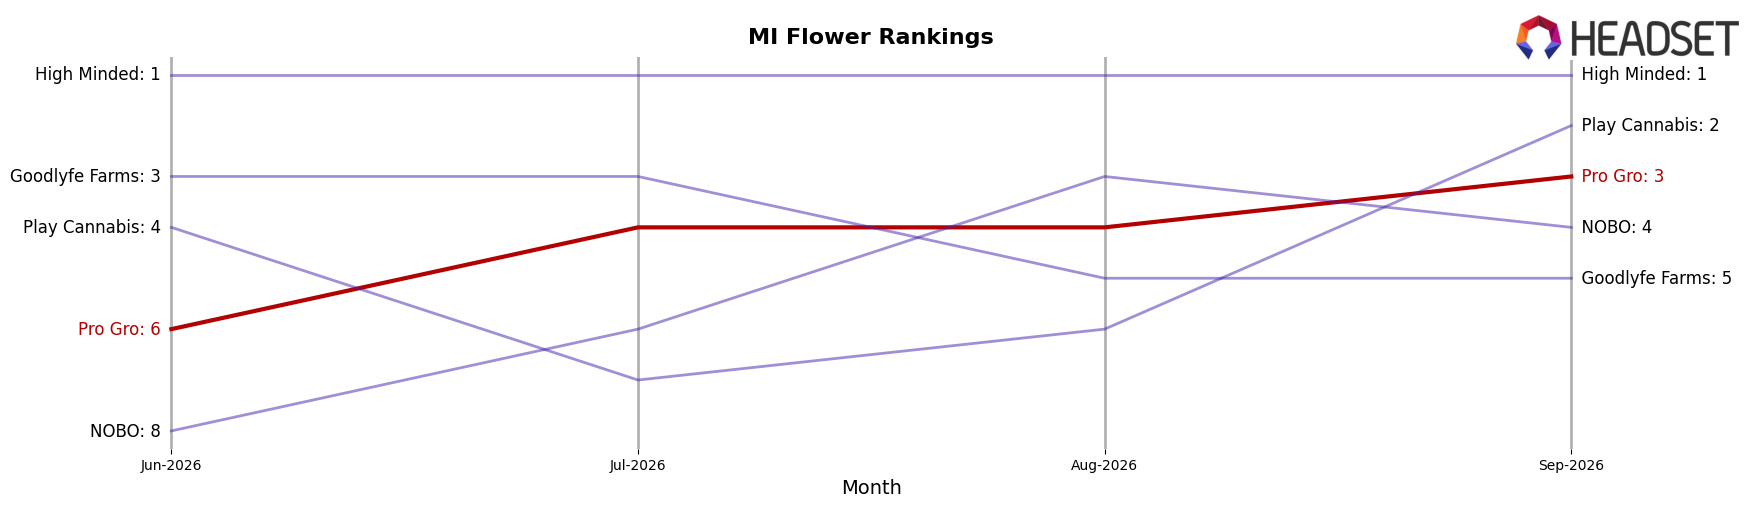
Pro Gro sits at rank #3 in Michigan Flower in September 2026, improving 3 positions year over year from #6, and climbing 3 spots since June 2026 from #6 to #3; against this, category leader High Minded held #1 both year over year and currently while its sales declined 3.3%, and Play Cannabis advanced from #7 to #2 with 33.3% YoY sales growth, signaling that Pro Gro’s ascent back toward its February 2025 peak of #2 depends on sustaining share gains against a flat #1 and a faster-rising #2.
Notable Products
Garlic Breath Pre-Roll (1g) defines September 2026 with a -32.1% month-over-month drop while holding rank 4, outpacing the next steep decline of -24.9% at rank 9, which signals fragility in mid-table retention despite top-end stability. In contrast, Planet Purple Pre-Roll (1g) climbed 25.6% to rank 5 and Super Boof Pre-Roll (1g) rose 22.6% at rank 3, while Moonbow #112 Pre-Roll (1g) added 19.8% and remains rank 1 with $157,107, indicating that momentum is concentrated at the top even as the tail softens.
Eight of the top ten are Pre-Roll SKUs, with rank positions 1 through 6 fully occupied by the format and only two material negatives exceeding -20%, implying the category’s breadth is intact but mix is shifting toward fewer high-velocity leaders. The pattern suggests Pro Gro is consolidating around flagship Pre-Roll winners as secondary SKUs shed share, a setup that favors depth in top performers over wide SKU proliferation.
Top Selling Cannabis Brands






Data for this report comes from real-time sales reporting by participating cannabis retailers via their point-of-sale systems, which are linked up with Headset’s business intelligence software. Headset’s data is very reliable, as it comes digitally direct from our partner retailers. However, the potential does exist for misreporting in the instance of duplicates, incorrectly classified products, inaccurate entry of products into point-of-sale systems, or even simple human error at the point of purchase. Thus, there is a slight margin of error to consider. Brands listed on this page are ranked in the top twenty within the market and product category by total retail sales volume.

