Jun-2026
Sales
Trend
6-Month
Product Count
SKUs
Avg Price
YoY Sales Change
YoY Price Change
Market Insights Snapshot
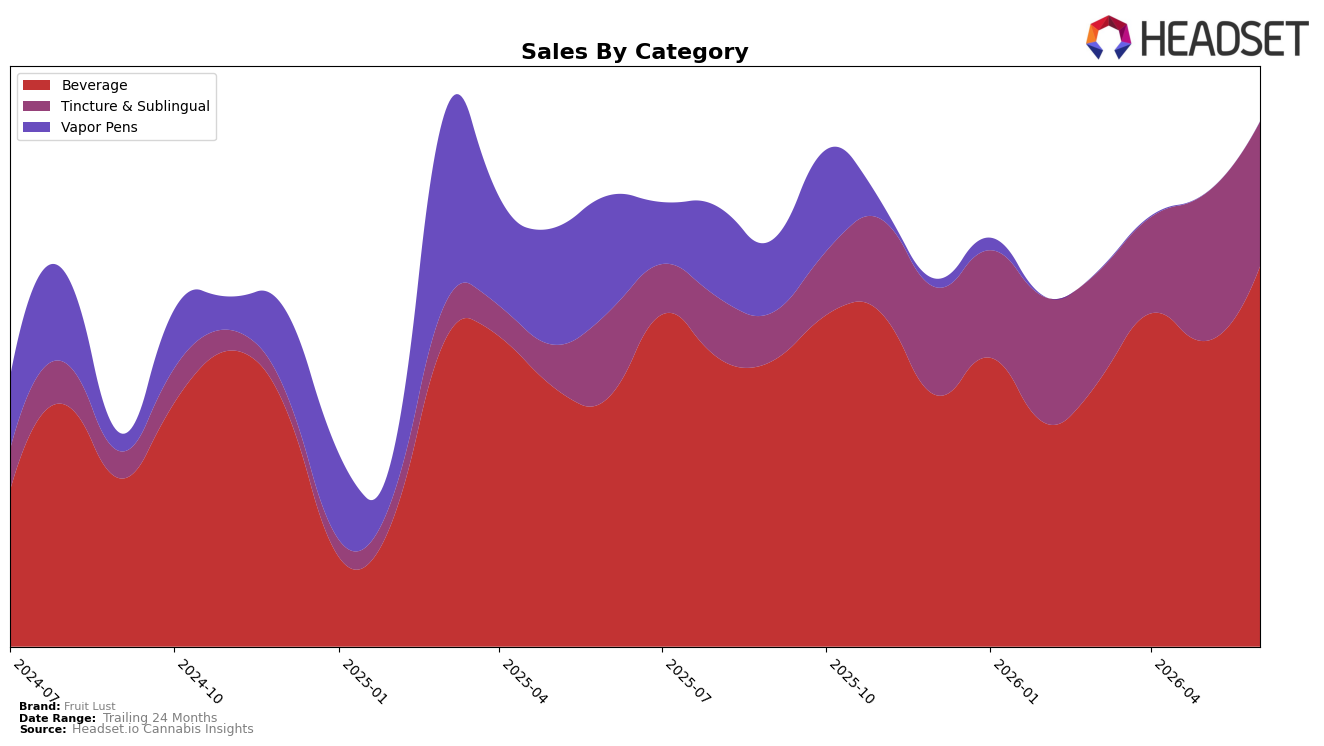
Fruit Lust concentrated 72.44% of June 2026 sales in Beverage, up 24.42% month over month and 52.81% year over year, while Tincture & Sublingual held 27.56% share with a -1.42% MoM dip despite 69.88% YoY growth. The brand’s overall sales rose 16.48% YoY with an 11.00% YoY increase in average price to $23.87, yet Beverage’s average price at $26.65 outpaced Tincture & Sublingual at $18.73, implying category mix uplift rather than broad price-based expansion; the thesis is that the accelerating Beverage mix, paired with moderating Tincture & Sublingual momentum, is pulling June 2026 results more than price alone.
With Beverage at 72.44% share and ranked 6 in Oregon Beverage, the 24.42% MoM surge alongside a -1.42% MoM move in Tincture & Sublingual signals a positioning tilt toward higher-priced, faster-cycling Beverage formats over lower-priced tincture SKUs. The implication is that prioritizing Beverage assortment and activation can compound the 52.81% YoY category gain and help convert the 27.56% Tincture & Sublingual share—despite its 69.88% YoY growth—into a feeder for Beverage trial, anchoring Fruit Lust’s near-term competitive stance around fewer, higher-velocity Beverage lines.
Competitive Landscape
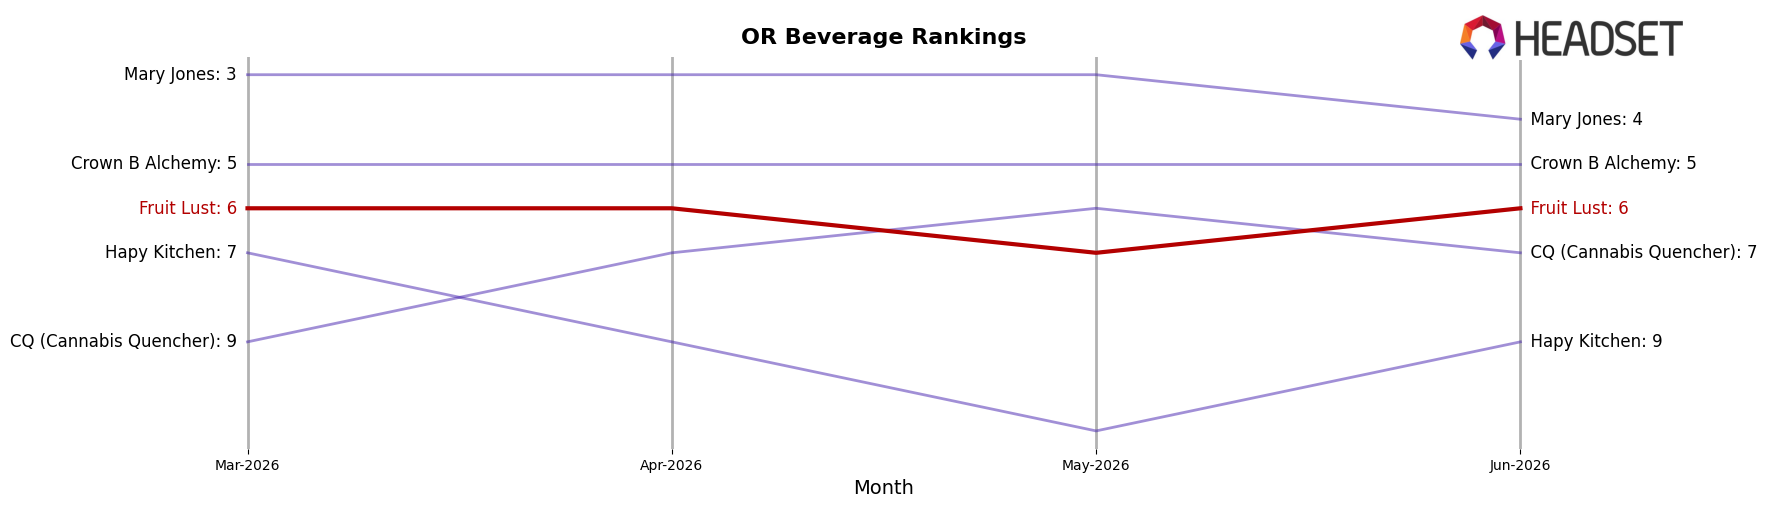
Fruit Lust sits at #6 in OR Beverage in June 2026, improving 1 rank from #7 year over year while holding flat versus three months ago at #6, and reaching its peak rank of #6 in June 2026; against this stability, Mary Jones advanced from #5 to #4 with 58.14% YoY sales growth, while Crown B Alchemy slipped from #4 to #5 with a -20.91% YoY decline, indicating Fruit Lust’s incremental rank gain came amid mixed competitor momentum where leaders like Magic Number held #1 with 14.19% YoY growth and Keef Cola stayed #2 despite a -19.14% YoY contraction; the pattern implies Fruit Lust’s ceiling near #6 persists unless it converts competitor contractions into share capture quickly.
Notable Products
Raspberry Syrup (1000mg THC, 4oz) delivered the standout move in June 2026 with a 64.2% month-over-month jump to rank 1, while Strawberry Juice Box Tincture (1000mg) fell 10.9% to rank 3. Passion Fruit Juice Box Tincture (1000mg) rose 49.9% into a shared rank 7, and Watermelon Nano Syrup (1000mg THC, 4oz) added 17.4% at rank 2. With seven of the top ten as Beverage SKUs, the mix implies Fruit Lust is consolidating leadership in drinkable formats, steering portfolio energy toward syrups over tinctures.
Top Selling Cannabis Brands
Data for this report comes from real-time sales reporting by participating cannabis retailers via their point-of-sale systems, which are linked up with Headset’s business intelligence software. Headset’s data is very reliable, as it comes digitally direct from our partner retailers. However, the potential does exist for misreporting in the instance of duplicates, incorrectly classified products, inaccurate entry of products into point-of-sale systems, or even simple human error at the point of purchase. Thus, there is a slight margin of error to consider. Brands listed on this page are ranked in the top twenty within the market and product category by total retail sales volume.

