Jun-2026
Sales
Trend
6-Month
Product Count
SKUs
Avg Price
YoY Sales Change
YoY Price Change
Market Insights Snapshot
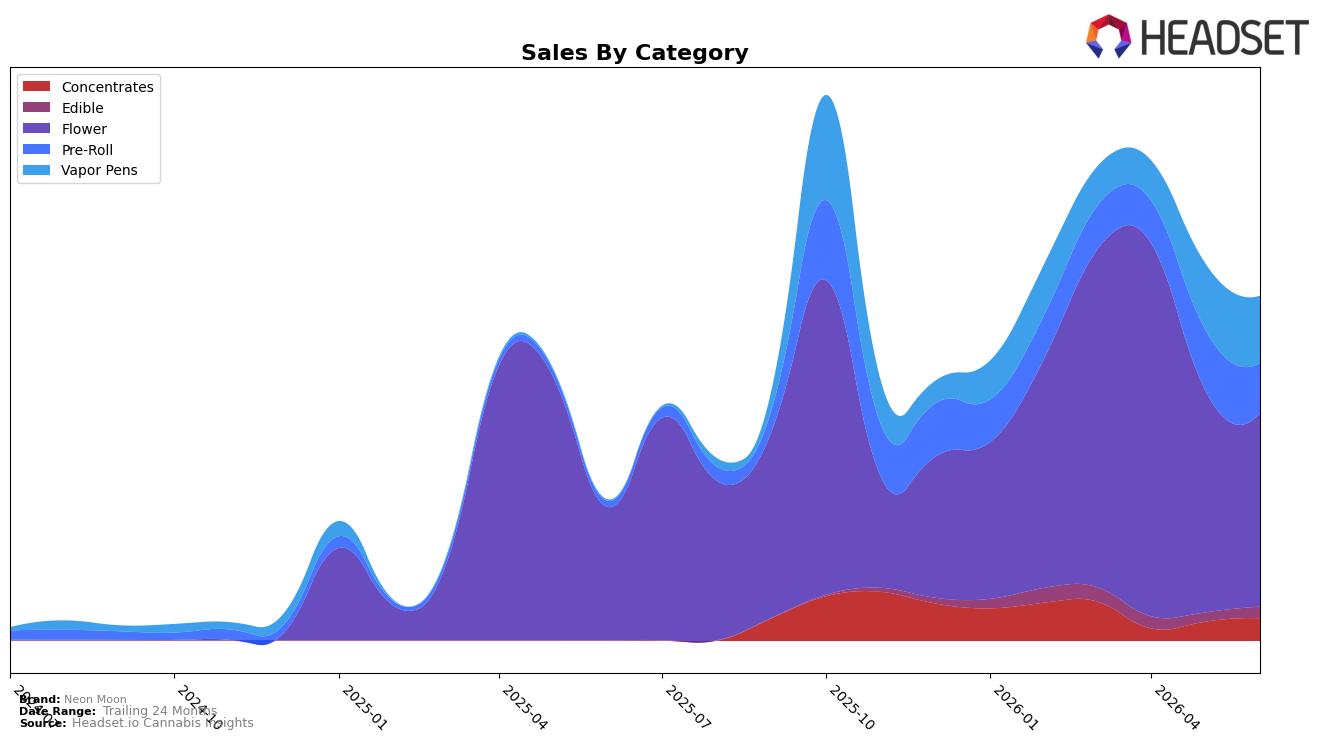
In June 2026, Neon Moon’s mix tilted toward Flower at 56.29% share with a 45.53% year-over-year lift but a 13.32% month-over-month decline, while Vapor Pens reached 19.39% share on a 5,933.47% year-over-year surge and a 1.57% month-over-month gain. Pre-Roll held 14.54% share with 761.99% year-over-year growth but fell 17.39% month over month, as Concentrates climbed 18.80% month over month to 6.50% share and Edible rose 25.77% month over month to 3.28% share. The average price fell 27.16% year over year to $19.08, implying the brand is trading mix toward faster-turn formats while pricing down to widen reach, with rank 10 in Flower in NV reinforcing a need to balance depth in its lead category against volatility in monthly flow.
The pattern points to portfolio-led distribution gains: the outsized 5,933.47% year-over-year rise in Vapor Pens alongside a 761.99% year-over-year jump in Pre-Roll suggests Neon Moon is adding doors or SKUs in accessible price tiers, while the 13.32% month-over-month dip in Flower and 17.39% month-over-month dip in Pre-Roll indicate short-term cannibalization or inventory timing as Concentrates and Edible posted 18.80% and 25.77% month-over-month growth. With a 56.29% Flower weight but a top-10 rank in NV rather than top-5, the mix shift implies a deliberate push to diversify away from single-category dependence, prioritizing repeatable basket attach from Vapor Pens and Pre-Roll while using lower year-over-year average prices to trade shoppers across forms without eroding total share.
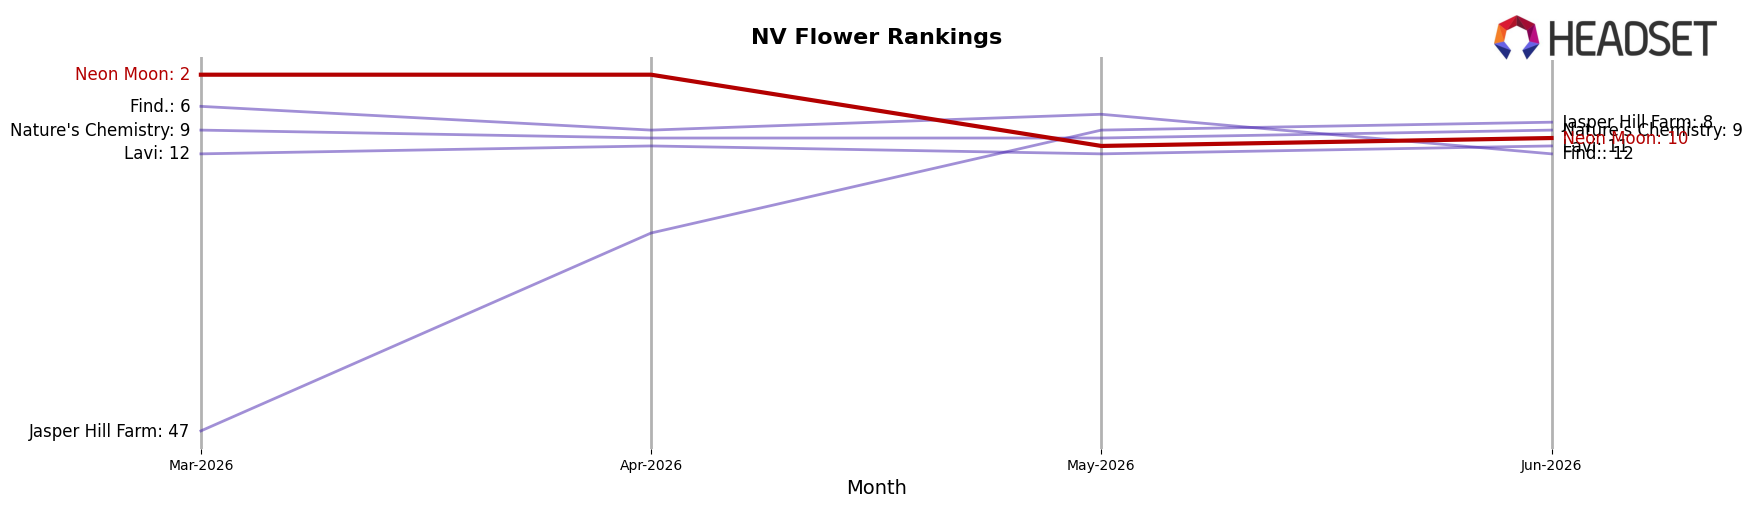
Competitive Landscape
Neon Moon sits at rank #10 in Nevada Flower for June 2026, a 2-place improvement from #12 year over year, but a steep drop from #2 in April 2026 to #10 by June 2026 signals rapid share reallocation. While STIIIZY held #1 with a 5.17% YoY sales increase and RYTHM advanced from #4 to #2 despite a -6.87% YoY decline, Neon Moon’s slide from #2 to #10 over the last three months contrasts with FloraVega / Welleaf jumping from #22 to #3 on 260.35% YoY growth and Good Green holding #4 while facing a -21.98% YoY sales contraction. The pattern implies Neon Moon’s spring spike to #2 was transient and that without regaining share from faster climbers, its trajectory points to mid-tier positioning rather than sustained top-5 presence.
Notable Products
Wingsuit Pre-Roll (1g) posted the steepest movement in June 2026 with a -60.3% month-over-month drop to $8,072 and slid to rank 5, while Plum Sangria Pre-Roll (1g) also contracted by -13.2% yet held rank 1. Flower concentrated the leaderboard with three of the top ten, led by Purple Starfruit (14g) at rank 2 and Grape Bubblegum (14g) at rank 3, whereas Blueberry Muffin Live Resin Disposable (0.5g) fell -22.9% at rank 8, signaling category divergence between Flower stability and volatility in Pre-Roll and Vapor Pens. The pattern implies Neon Moon’s commercial direction is tilting toward larger-pack Flower as the dependable volume anchor while single-serve inhalables face sharper demand whipsaws.
Top Selling Cannabis Brands
Data for this report comes from real-time sales reporting by participating cannabis retailers via their point-of-sale systems, which are linked up with Headset’s business intelligence software. Headset’s data is very reliable, as it comes digitally direct from our partner retailers. However, the potential does exist for misreporting in the instance of duplicates, incorrectly classified products, inaccurate entry of products into point-of-sale systems, or even simple human error at the point of purchase. Thus, there is a slight margin of error to consider. Brands listed on this page are ranked in the top twenty within the market and product category by total retail sales volume.

