.svg)


Where to Buy
Giving Tree Gardens is stocked at 158 licensed dispensaries across Michigan and Nevada, 156 of them in Michigan, with the deepest coverage in New Buffalo, Monroe, Detroit, Grand Rapids, and Hazel Park. Search by ZIP code or city below to find the closest one, or filter by product type if you are after a specific format.
Market Insights Snapshot
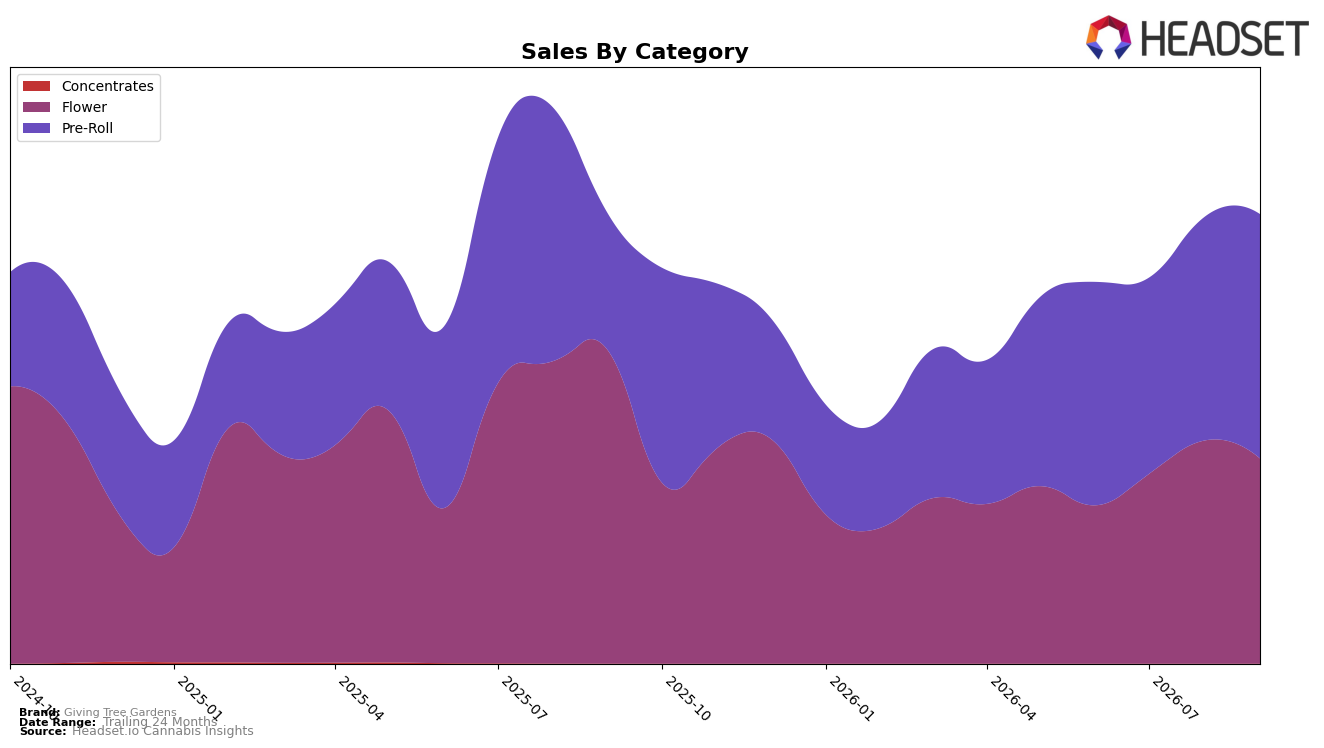
In September 2026, Giving Tree Gardens derived 54.36% of sales from Pre-Roll and 45.64% from Flower, with Pre-Roll up 79.0% year over year and 9.26% month over month while Flower fell 34.41% YoY and 8.06% MoM; the brand’s overall sales rose 3.28% YoY despite a 7.92% YoY drop in average price, indicating mix and pricing are moving in opposite directions. Pre-Roll’s average price at $4.99 contrasted with Flower at $21.08, and the tilt toward lower-priced units alongside a MoM share gain for Pre-Roll implies the brand is reallocating volume toward faster-turning, value-oriented formats to sustain unit velocity even as Flower contracts.
With Pre-Roll now the top category and ranked 34 in Michigan Pre-Roll, the 79.0% YoY surge and 9.26% MoM uptick suggest a defend-and-build posture in value-led impulse formats, while the 34.41% YoY and 8.06% MoM declines in Flower compress premium exposure and margin mix. The combination of a 3.28% YoY brand sales increase and a 7.92% YoY average price decrease points to unit-led growth concentrated in Pre-Roll, implying near-term positioning as a price-competitive Pre-Roll player in Michigan rather than a premium Flower destination.
Competitive Landscape
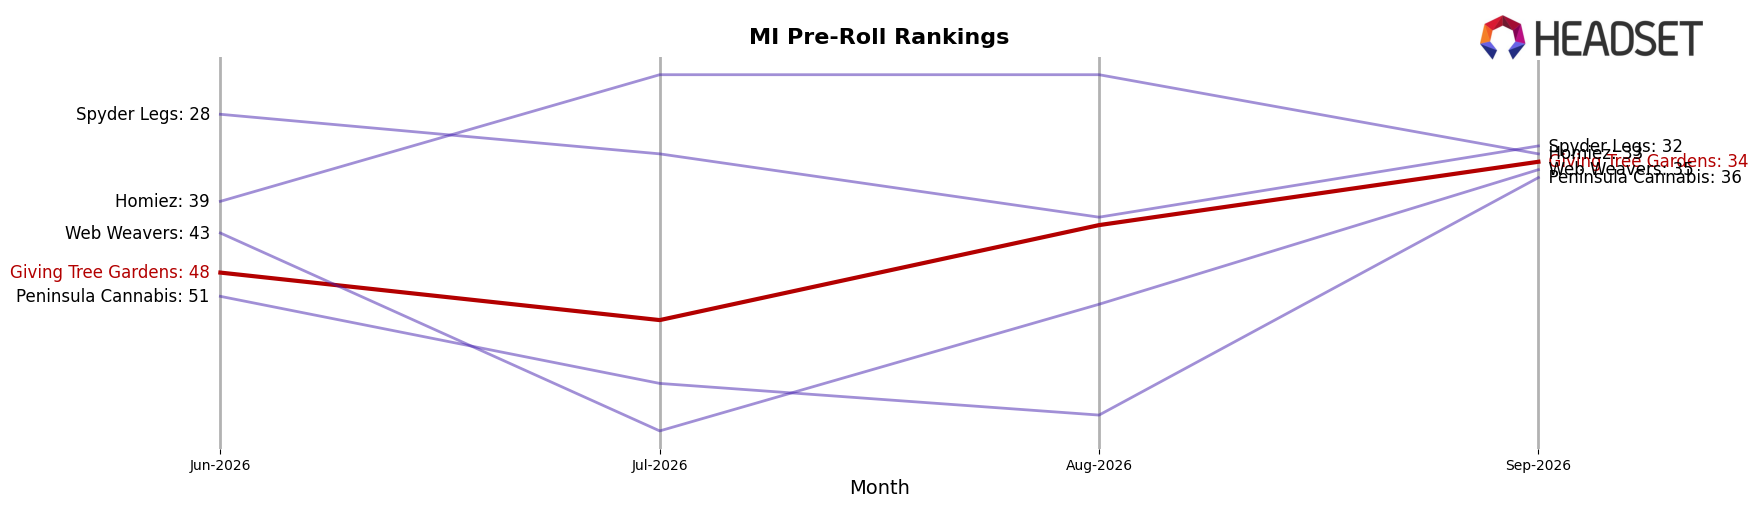
Giving Tree Gardens sits at rank #34 in MI Pre-Roll for September 2026 after climbing 29 places year over year from #63, and it improved 14 spots from June 2026’s #48 to reach a new peak rank of #34 in September 2026. In contrast, Jeeter held steady at #1 year over year while growing sales by 149.9%, and Cali-Blaze stayed at #2 but with a 36.1% sales decline, indicating that upward mobility at the lower tiers coexists with stability at the top. The pattern implies that Giving Tree Gardens’ rank trajectory is driven more by share consolidation among top competitors than by broad category churn, positioning it to capture incremental share if it converts recent rank gains into sustained velocity.
Notable Products
Mile High Club Pre-Roll (1g) delivered the standout movement in September 2026 with a 171% month-over-month surge, jumping into rank 4 while Captain Krunch Pre-Roll (1g) fell 26% and slid to rank 3. Orange Tree Pre-Roll (1g) held rank 1 despite a 14% decline, and Forbidden Fruit Pre-Roll (1g) rose 50% to rank 2, concentrating momentum at the top. With ten of the top ten SKUs in the Pre-Roll category and one unit posting roughly $31,250 in September 2026, the mix implies a strategy tilting deeper into Pre-Rolls where volatility is creating rapid share reshuffles.
Top Selling Cannabis Brands






Data for this report comes from real-time sales reporting by participating cannabis retailers via their point-of-sale systems, which are linked up with Headset’s business intelligence software. Headset’s data is very reliable, as it comes digitally direct from our partner retailers. However, the potential does exist for misreporting in the instance of duplicates, incorrectly classified products, inaccurate entry of products into point-of-sale systems, or even simple human error at the point of purchase. Thus, there is a slight margin of error to consider. Brands listed on this page are ranked in the top twenty within the market and product category by total retail sales volume.

