.svg)
Sep-2026
Sales
Trend
6-Month
Product Count
SKUs
Avg Price
YoY Sales Change
YoY Price Change


Where to Buy
Redemption is stocked at 317 licensed dispensaries across Michigan, Maryland, and 4 other states, 196 of them in Michigan, with the deepest coverage in Grand Rapids, New Buffalo, Lansing, Adrian, and Kalamazoo. Search by ZIP code or city below to find the closest one, or filter by product type if you are after a specific format.
Market Insights Snapshot
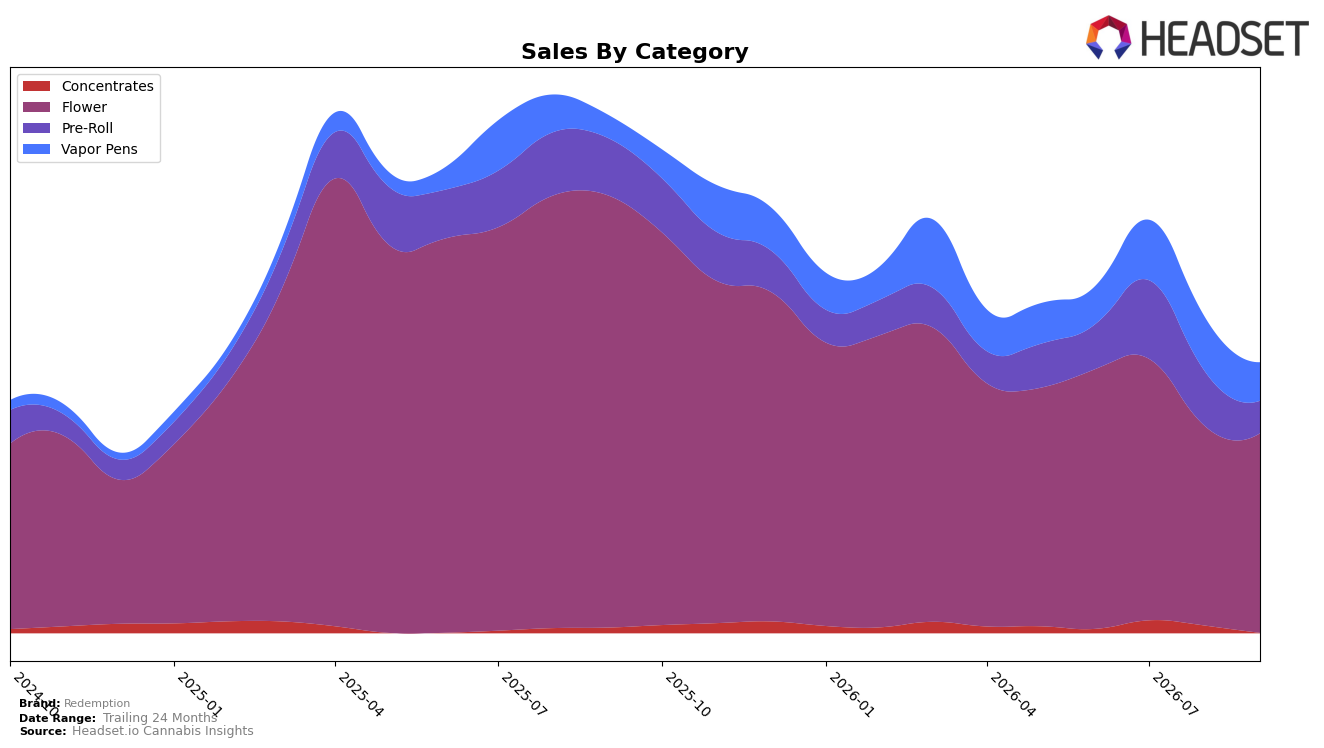
Redemption’s category mix in September 2026 concentrated 64.77% of sales in Flower, where year-over-year sales contracted by 51.99% and month-over-month slipped 0.04%, while Vapor Pens rose 39.74% YoY to a 16.18% share but fell 22.79% MoM. Pre-Roll held 14.36% share with a 34.31% YoY decline and a 31.90% MoM drop, and Concentrates at 4.69% share declined 25.47% YoY and 32.10% MoM; combined, these shifts helped pull total brand sales down 42.75% YoY despite a 0.84% YoY decrease in average price to $20.81. The pattern implies overexposure to Flower volatility alongside short-cycle pullbacks in non-Flower formats, with September 2026 momentum hinging more on mix contraction than on pricing.
Positioning-wise, a 64.77% Flower dependency alongside an 18th rank in Flower in Maryland indicates that Redemption’s share is tied to a lagging category where YoY demand fell 51.99% for the brand, while the comparatively smaller Vapor Pens franchise posted 39.74% YoY growth but lost 22.79% MoM, and Pre-Roll and Concentrates shed 31.90% and 32.10% MoM respectively. With Vapor Pens at only 16.18% share and Pre-Roll at 14.36% despite their differing YoY trajectories, the mix suggests underweighting of the only expanding YoY format and an outsized reliance on a contracting core; the implication is that near-term rank and share gains will require redirecting portfolio weight from Flower into Vapor Pens to convert YoY growth into durable MoM stability.
Competitive Landscape
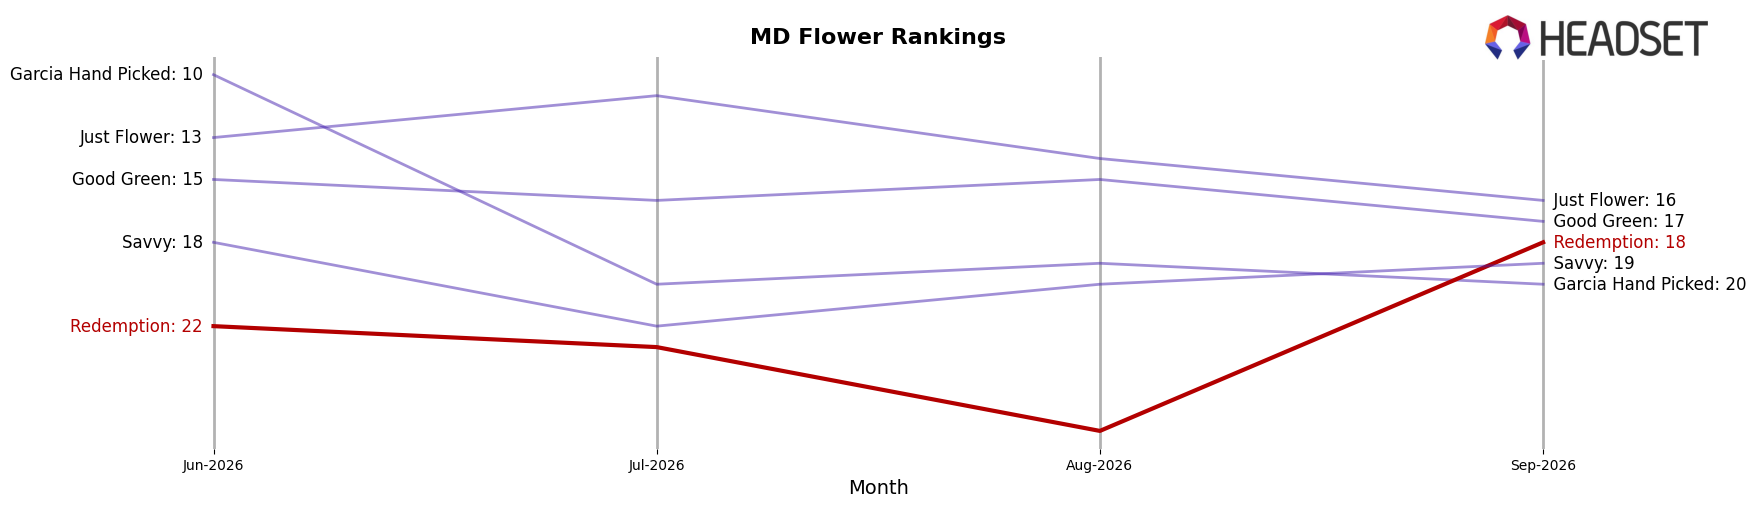
Redemption sits at rank #18 in September 2026, improving 5 positions from #23 year over year and rising 4 spots from #22 since June 2026, while also marking a peak rank of #18 in September 2026; in contrast, District Cannabis slid from #2 to #4 with a 29.36% YoY sales decline and Strane advanced from #10 to #5 alongside a 45.97% YoY sales increase, indicating that Redemption’s upward rank shift is occurring amid widening performance dispersion at the top and implies the brand is moving from peripheral consideration toward the competitive middle tier if it sustains share gains.
Notable Products
Boss Lady (3.5g) posted the steepest movement in September 2026 with a -34.7% month-over-month drop while holding rank 10, contrasting with Bubble Bath (3.5g) up 25.0% at rank 4. Lemon Cherry Diesel (3.5g) remained rank 1 despite a -4.0% decline, and Mafia Funeral (3.5g) fell -19.7% at rank 7, indicating uneven traction across the lineup. With nine of the top ten SKUs in Flower, concentration is high, and Candy Mob (3.5g) in rank 9 grew 6.7% as Sweet N' Gassy (7g) in rank 2 edged up 1.1%, pointing to a mix where a few mid-pack movers offset sharp declines at the tail. The pattern implies Redemption is leaning into a Flower-heavy portfolio where leadership SKUs carry share stability while volatility in lower ranks signals a need for SKU pruning or targeted support.
Top Selling Cannabis Brands






Data for this report comes from real-time sales reporting by participating cannabis retailers via their point-of-sale systems, which are linked up with Headset’s business intelligence software. Headset’s data is very reliable, as it comes digitally direct from our partner retailers. However, the potential does exist for misreporting in the instance of duplicates, incorrectly classified products, inaccurate entry of products into point-of-sale systems, or even simple human error at the point of purchase. Thus, there is a slight margin of error to consider. Brands listed on this page are ranked in the top twenty within the market and product category by total retail sales volume.

