May-2026
Sales
Trend
6-Month
Product Count
SKUs
Avg Price
YoY Sales Change
YoY Price Change
Market Insights Snapshot
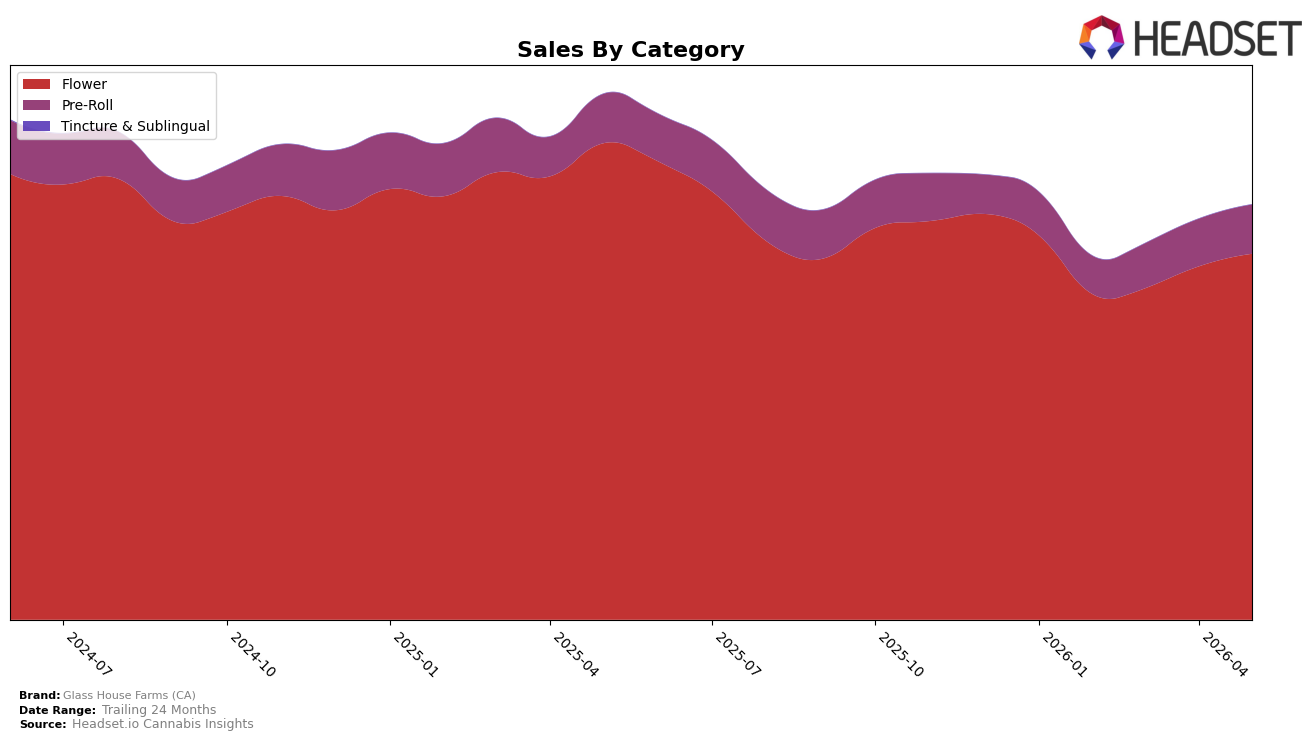
In May 2026, Glass House Farms (CA) concentrated 88.21% of sales in Flower while Pre-Roll accounted for 11.79%, with Flower up 3.57% month over month but down 23.23% year over year, and Pre-Roll up 3.49% month over month but nearly flat year over year at -0.18%. The brand’s average price fell 13.28% year over year alongside a 21.08% brand-level sales decline, while within the mix Flower held a higher average price at $24.49 versus $6.84 in Pre-Roll, indicating volume recovery month over month did not offset year-over-year pressure; the pattern implies a price-led strategy is cushioning near-term unit trends without reversing the longer-term share compression in core Flower.
Holding rank 14 in Flower in California with Flower at 88.21% share and a 3.57% month-over-month lift, alongside Pre-Roll’s 3.49% month-over-month gain and -0.18% year-over-year change, suggests the brand is leaning into incremental velocity rather than trading mix into faster-growing segments. With brand sales down 21.08% year over year against a 13.28% price decline and Flower down 23.23% year over year, the current positioning anchors on scale in core Flower rather than diversification; the implication is that sustaining rank 14 will likely require either deeper price-action in Flower or a deliberate reweighting toward Pre-Roll to buffer volatility in the primary category.
Competitive Landscape
Glass House Farms (CA) sits at rank #14 in California Flower in May 2026, down 1 position from #13 year over year, while improving 1 spot from #15 three months ago; the brand’s best historical mark of #12 in March 2025 remains 2 places higher than today. Competitive pressure tightened at the top: CAM climbed from #4 to #1 with 46.9% year-over-year sales growth, and STIIIZY held #2 with 39.7% year-over-year growth, whereas CannaBiotix (CBX) slipped from #1 to #3 alongside an 8.3% year-over-year sales decline; against this backdrop, Glass House Farms (CA)’s slight YoY rank dip and modest quarter-over-quarter gain imply a stable-but-stalled trajectory that risks ceding share unless it converts recent incremental momentum into a return toward its #12 peak.

Notable Products
Glass House Farms (CA)'s steepest movement in May 2026 was Garlic Brown Butter (7g), which fell -42.8% month over month and sat at rank 5, while Lilac Diesel (7g) declined -24.7% to rank 4. Within Pre-Roll, Sour Diesel Pre-Roll (1g) dropped -29.3% to rank 10, whereas Super Silver Haze Pre-Roll (1g) slipped a modest -1.2% to rank 9. With four Pre-Rolls in the top ten and three 7g Flower SKUs clustered between ranks 3 and 6, the mix points to a pivot toward Pre-Roll trial at the top while value-oriented 7g Flower endures pressure, implying near-term emphasis on ready-to-smoke formats over bulk Flower.
Top Selling Cannabis Brands
Data for this report comes from real-time sales reporting by participating cannabis retailers via their point-of-sale systems, which are linked up with Headset’s business intelligence software. Headset’s data is very reliable, as it comes digitally direct from our partner retailers. However, the potential does exist for misreporting in the instance of duplicates, incorrectly classified products, inaccurate entry of products into point-of-sale systems, or even simple human error at the point of purchase. Thus, there is a slight margin of error to consider. Brands listed on this page are ranked in the top twenty within the market and product category by total retail sales volume.

