.svg)

Sep-2026
Sales
Trend
6-Month
Product Count
SKUs
Avg Price
YoY Sales Change
YoY Price Change


Market Insights Snapshot
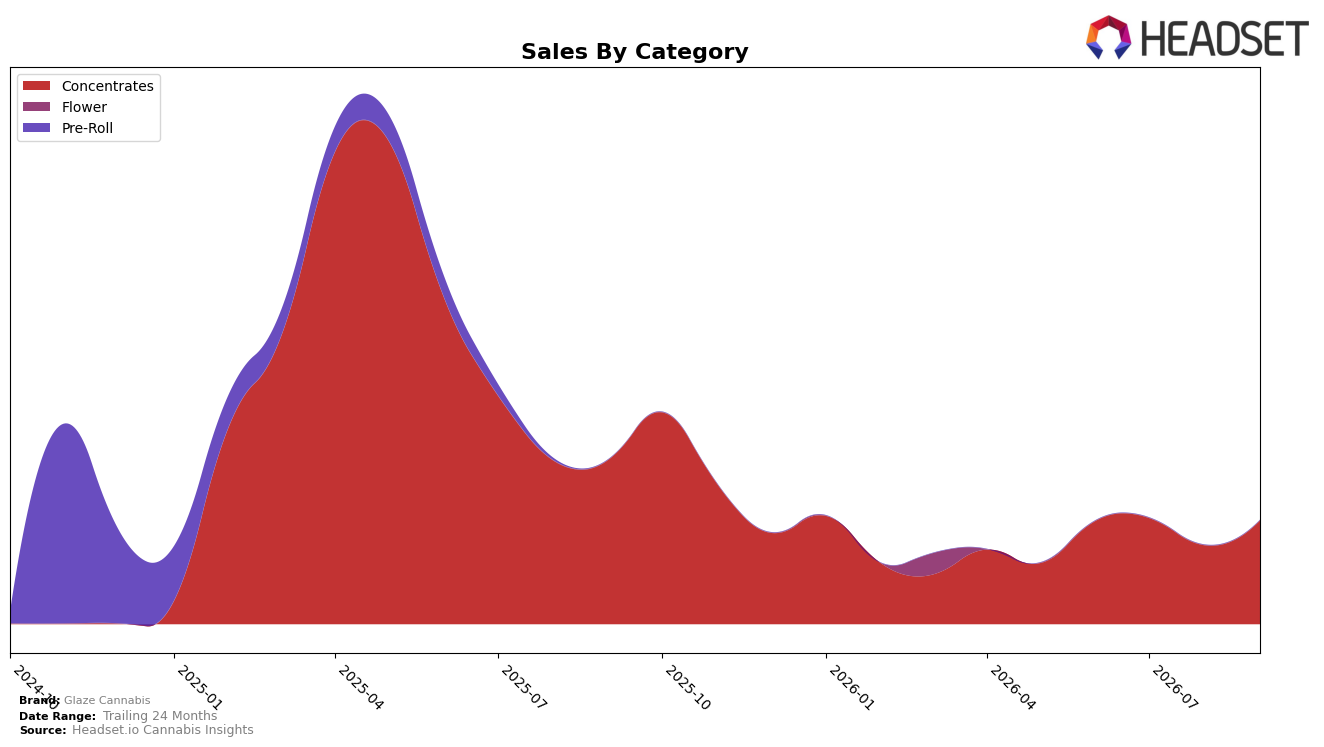
Glaze Cannabis operated as a single-category brand in September 2026, with Concentrates accounting for 100.0% of sales, a year-over-year decline of 36.98% alongside a month-over-month increase of 31.55%. Average price fell 5.87% year over year to $23.17, while share concentration at 100.0% and a state-category rank of 49 indicate narrow placement within Massachusetts Concentrates; the pattern implies a tactical rebound within the month that does not offset the annual contraction, leaving category exposure concentrated and rank pressure intact.
The shift toward a sole focus on Concentrates with a 31.55% month-over-month lift but a 36.98% year-over-year decline suggests reliance on episodic demand spikes rather than durable baseline velocity, positioning Glaze Cannabis as a niche player in Massachusetts Concentrates with sensitivity to price and promotional windows. With a 5.87% year-over-year drop in average price and a rank position at 49, the configuration implies a price-led recovery path that can capture short-term share within the category yet risks margin compression and limited cross-category insulation if volatility persists.
Competitive Landscape
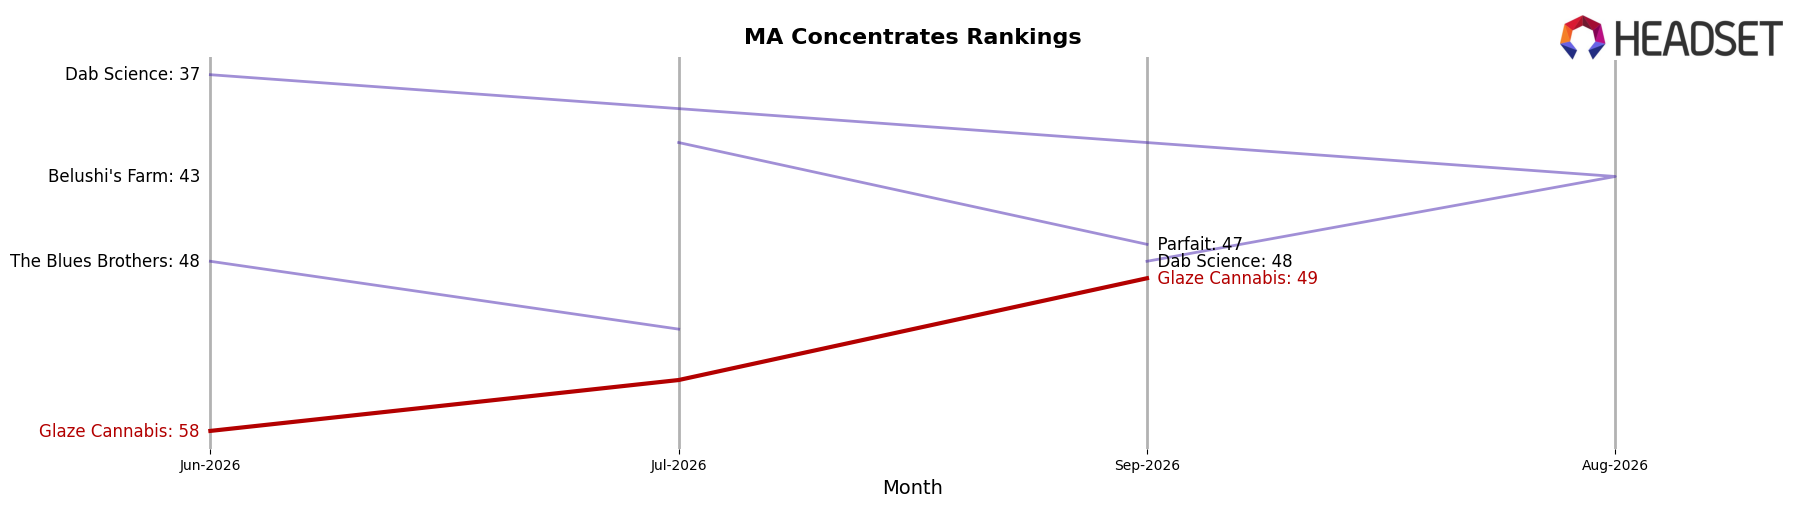
Glaze Cannabis sits at rank #50 in Massachusetts Concentrates for September 2026, down 5 positions year over year from #45 and up 8 positions versus June 2026’s #58, while still distant from its peak at #20 in May 2025; in contrast, Good Chemistry Nurseries held #1 with a 0-position YoY change and Harbor House Collective advanced from #8 to #5 alongside a 47.39% YoY sales increase. With Crispy Commission Concentrates steady at #2 despite a 24.04% YoY sales decline and Nature's Heritage fixed at #3 while growing sales 24.48% YoY, the competitive set shows upward mobility concentrated at the top ranks as Glaze Cannabis oscillates mid-pack; the combination of a 5-rank YoY slip and a 3-month climb of 8 ranks implies a recovery from a mid-year trough rather than durable share capture.
Notable Products
Peaches n Cream Wax (1g) posted the month’s sharpest surge at +193.9% MoM, climbing into rank 3 while Blueberry Cake Wax (1g) jumped +118.1% MoM to rank 2. In contrast, Lemon Squares Wax (1g) fell -51.5% MoM at rank 4, a reversal that offsets some gains at the top of the lineup. With all four top-10 SKUs concentrated in Concentrates and Apple Ice Wax (1g) holding rank 1 despite a smaller +34.8% MoM increase, the pattern implies a deliberate tilt toward a few breakout wax variants driving the category, even as underperformers are pruned.
Top Selling Cannabis Brands






Data for this report comes from real-time sales reporting by participating cannabis retailers via their point-of-sale systems, which are linked up with Headset’s business intelligence software. Headset’s data is very reliable, as it comes digitally direct from our partner retailers. However, the potential does exist for misreporting in the instance of duplicates, incorrectly classified products, inaccurate entry of products into point-of-sale systems, or even simple human error at the point of purchase. Thus, there is a slight margin of error to consider. Brands listed on this page are ranked in the top twenty within the market and product category by total retail sales volume.

