Jun-2026
Sales
Trend
6-Month
Product Count
SKUs
Avg Price
YoY Sales Change
YoY Price Change
Market Insights Snapshot
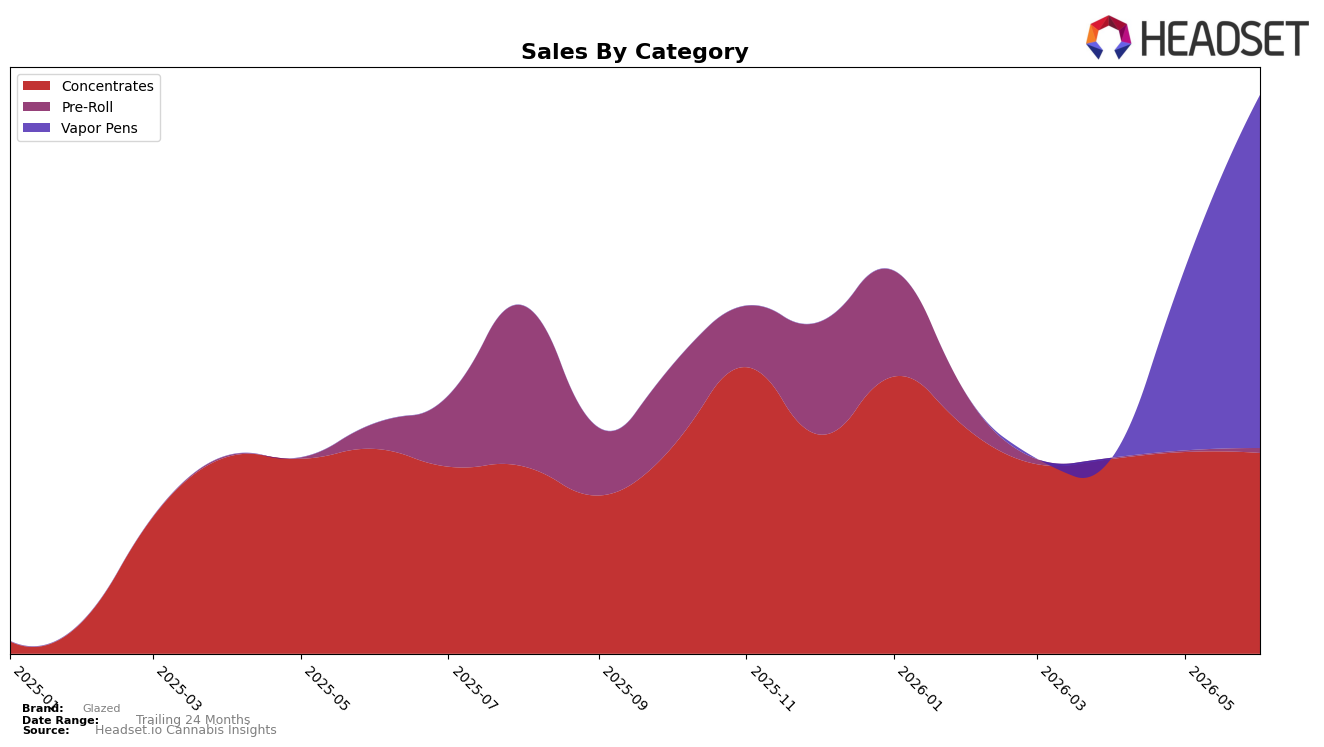
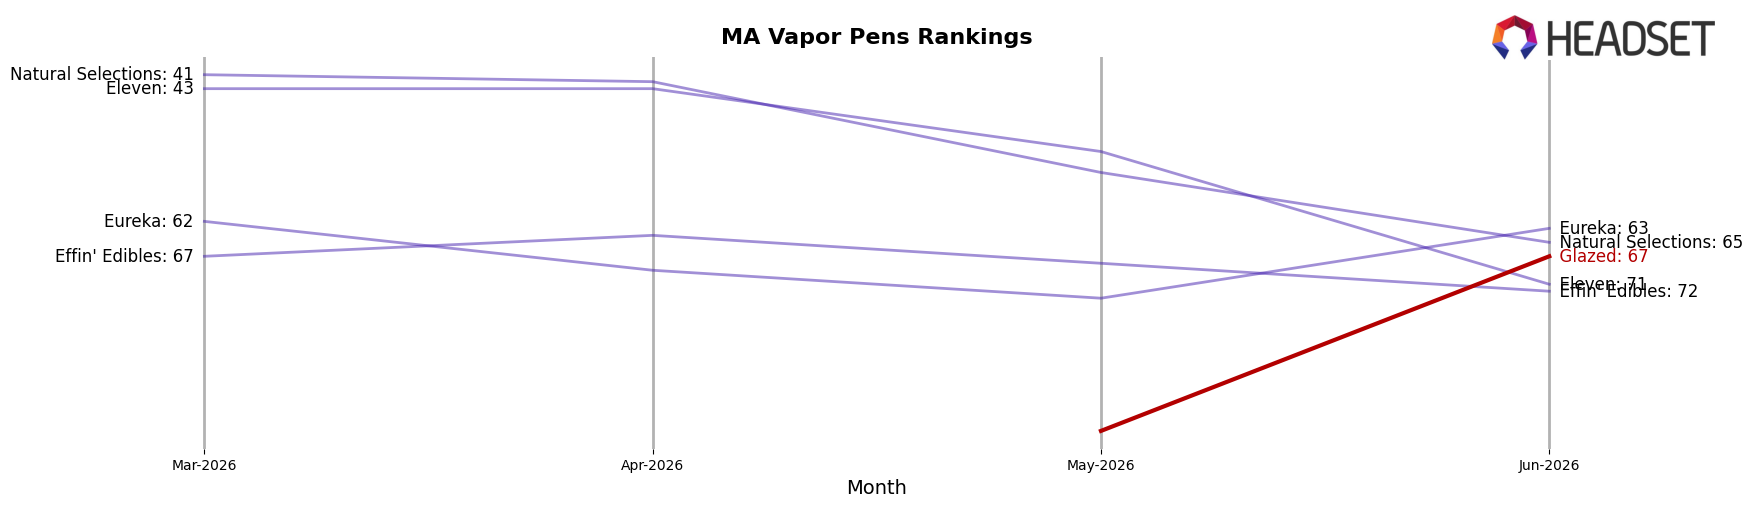
Glazed’s mix in June 2026 tilted toward Vapor Pens at 63.24% share with month-over-month growth of 94.30%, while Concentrates held 35.94% share with a -0.47% MoM change and a -1.95% year-over-year shift; Pre-Roll remained marginal at 0.82% share despite a 258.16% MoM jump alongside a -82.09% YoY decline. Average pricing moved to $21.58 with an -8.31% YoY change, and within the lead category Vapor Pens averaged $20.72, positioning value below the portfolio’s mean as the brand’s overall sales advanced 142.40% YoY; in Massachusetts Vapor Pens ranked 67th, indicating volume acceleration outpacing rank momentum. These patterns imply the brand is consolidating demand in a single growth engine while retreat in Pre-Roll YoY and flat-to-down trends in Concentrates cap breadth, so the thesis is that short-term gains are leveraged by Vapor Pens price-accessibility rather than multi-category depth.
The category shifts suggest Glazed is trading mix toward a price-competitive Vapor Pens corridor (Vapor Pens at 63.24% share with 94.30% MoM versus Concentrates at 35.94% with -0.47% MoM), compressing average price by -8.31% YoY to expand reach while accepting rank at 67 in Massachusetts Vapor Pens as a lagging indicator. With Pre-Roll’s 258.16% MoM from a 0.82% base and an -82.09% YoY, re-entry is tactical rather than foundational, so the thesis is that Glazed’s positioning now favors scaling volume through accessible Vapor Pens while Concentrates stability and Pre-Roll volatility act as optionality rather than core differentiation.
Competitive Landscape
Glazed is ranked #67 in Massachusetts Vapor Pens in June 2026, a new peak position with no year-over-year rank available, and the gap to the top is underscored by Fernway holding #1 while growing sales 56.4% year over year and Dime Industries moving from #9 to #5 alongside an 82.0% sales increase; by contrast, Select stayed at #2 with a 10.3% sales decline, indicating that upward mobility is tied to double‑digit growth and rank gains rather than incumbency. With Glazed peaking at #67 in June 2026 while Rove climbed from #5 to #4 on 17.0% growth and Perpetual Harvest held #3 despite a 5.3% decline, the pattern implies Glazed must generate sustained double‑digit share or velocity gains to convert an entry‑tier peak into a multi‑rank climb.
Notable Products
Pineapple Express Distillate Cartridge (1g) posted the largest month-over-month surge at +123% to rank 4 in June 2026, while Surf Storm Wax (1g) fell -16% to rank 9. Surf Storm Distillate Cartridge (1g) also jumped +121% to rank 2, and Blue Raspberry Haze Distillate Cartridge (1g) rose +109% to rank 3. Vapor Pens account for seven of the top ten SKUs, and that concentration combined with triple-digit gains at ranks 2–5 implies Glazed is consolidating around inhalable convenience formats rather than legacy concentrates.
Top Selling Cannabis Brands
Data for this report comes from real-time sales reporting by participating cannabis retailers via their point-of-sale systems, which are linked up with Headset’s business intelligence software. Headset’s data is very reliable, as it comes digitally direct from our partner retailers. However, the potential does exist for misreporting in the instance of duplicates, incorrectly classified products, inaccurate entry of products into point-of-sale systems, or even simple human error at the point of purchase. Thus, there is a slight margin of error to consider. Brands listed on this page are ranked in the top twenty within the market and product category by total retail sales volume.

