.svg)

Sep-2026
Sales
Trend
6-Month
Product Count
SKUs
Avg Price
YoY Sales Change
YoY Price Change


Where to Buy
Local Roots is stocked at 43 licensed dispensaries across Massachusetts, with the deepest coverage in Quincy, Worcester, Abington, Middleborough, and Arlington. Search by ZIP code or city below to find the closest one, or filter by product type if you are after a specific format.
Market Insights Snapshot
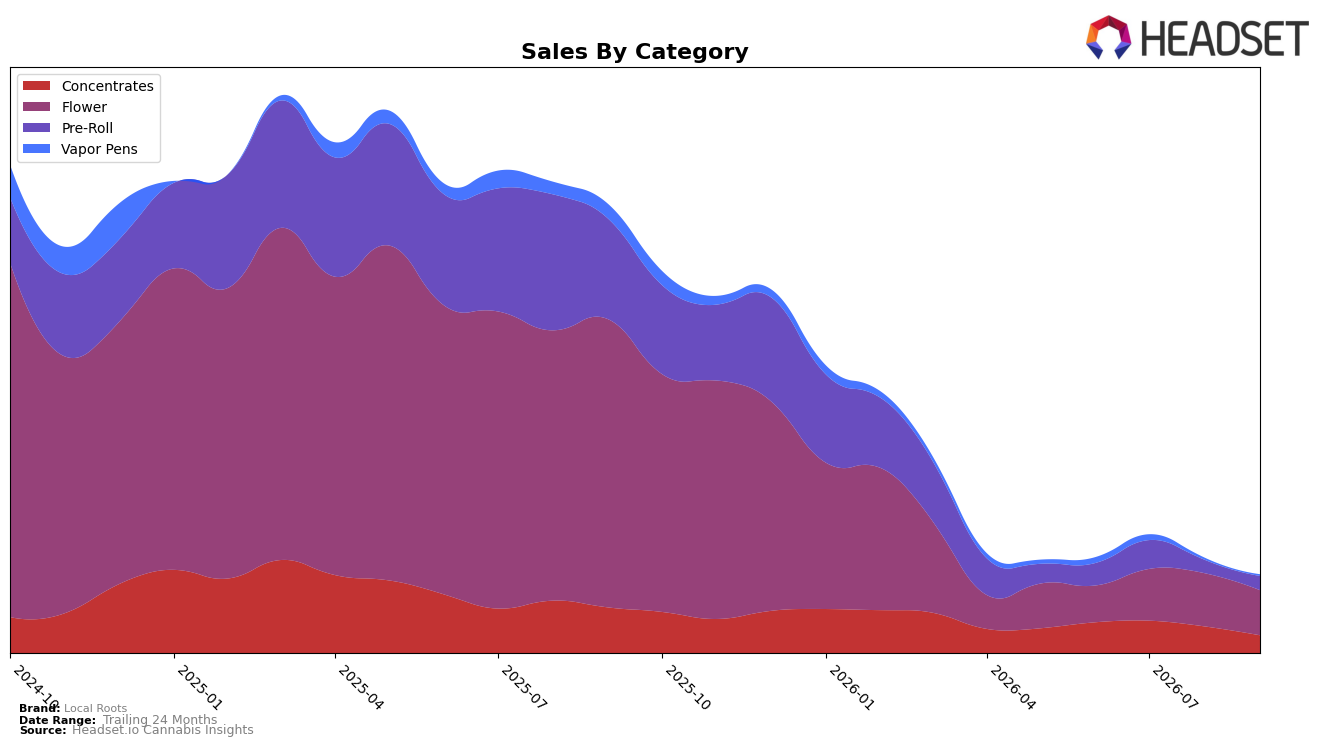
In September 2026, Local Roots concentrated 56.88% of sales in Flower, down 15.18% month over month and down 84.33% year over year, while Pre-Roll held 17.93% share with a 5.96% month-over-month uptick but an 85.84% year-over-year decline. Concentrates accounted for 22.96% share with a 32.74% month-over-month drop and a 60.45% year-over-year decline, and Vapor Pens represented 2.23% share with a 19.00% month-over-month decline and an 88.00% year-over-year decline. With the brand’s average price up 2.39% year over year to $17.04 and Flower ranked 100th in Massachusetts, the mix indicates a pivot toward value-driven Pre-Roll elasticity within an overall contracting base, implying reliance on Flower scale is no longer sufficient for category stability.
The combination of Flower’s 56.88% share alongside a 15.18% month-over-month decline and Pre-Roll’s 5.96% month-over-month rise suggests a substitution effect toward lower-priced formats as overall brand sales fell 82.34% year over year. Concentrates’ 22.96% share paired with a 32.74% month-over-month contraction, plus Vapor Pens’ 2.23% share and a 19.00% month-over-month decline, points to weakened potency-led and device-led demand at the current price architecture. Given the 100th-place rank in Massachusetts Flower and a 24-month sales decline of 86.28%, the pattern implies Local Roots’ positioning is tilting from premium-led breadth to a narrower, discount-sensitive lane where incremental Pre-Roll gains cannot offset persistent Flower and Concentrates compression.
Competitive Landscape
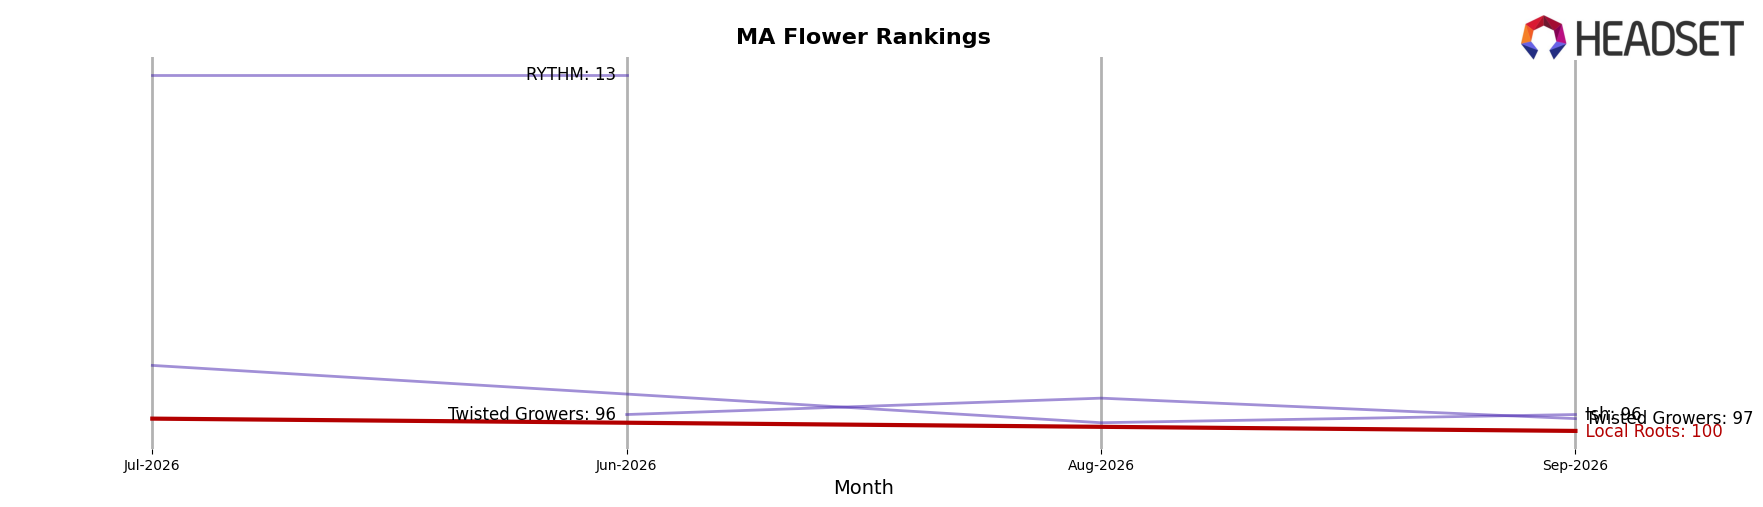
Local Roots sits at rank #100 in MA Flower in September 2026, improving 21 positions from #121 in June 2026 while falling 68 spots from its peak at #22 in September 2024; year over year, the brand is down 68 ranks from #32 to #100, indicating a long-cycle decline despite recent quarter-on-quarter recovery. In contrast, Perpetual Harvest is #1 after climbing 3 ranks year over year with 124.1% sales growth, while Simply Herb holds #3 with a 2-rank dip and a 16.6% sales decline, signaling that Local Roots’ rank improvement since June 2026 is occurring alongside mixed top-tier momentum and suggests stabilization rather than a return to its September 2024 peak trajectory.
Notable Products
Blueberry Hashplant (3.5g) led September 2026 with a 98% month-over-month surge to rank 1, while Forest Queen (3.5g) fell 69% to rank 6, signaling a sharp reordering within Flower. Pura Vida (3.5g) slipped 12% at rank 2, and three of the top ten are Flower SKUs, concentrating share in that category despite mixed trajectories. This pattern implies Local Roots is consolidating volume around a breakout Flower leader while pruning or repositioning weaker Flower variants.
Top Selling Cannabis Brands






Data for this report comes from real-time sales reporting by participating cannabis retailers via their point-of-sale systems, which are linked up with Headset’s business intelligence software. Headset’s data is very reliable, as it comes digitally direct from our partner retailers. However, the potential does exist for misreporting in the instance of duplicates, incorrectly classified products, inaccurate entry of products into point-of-sale systems, or even simple human error at the point of purchase. Thus, there is a slight margin of error to consider. Brands listed on this page are ranked in the top twenty within the market and product category by total retail sales volume.

