May-2026
Sales
Trend
6-Month
Product Count
SKUs
Avg Price
YoY Sales Change
YoY Price Change
Market Insights Snapshot
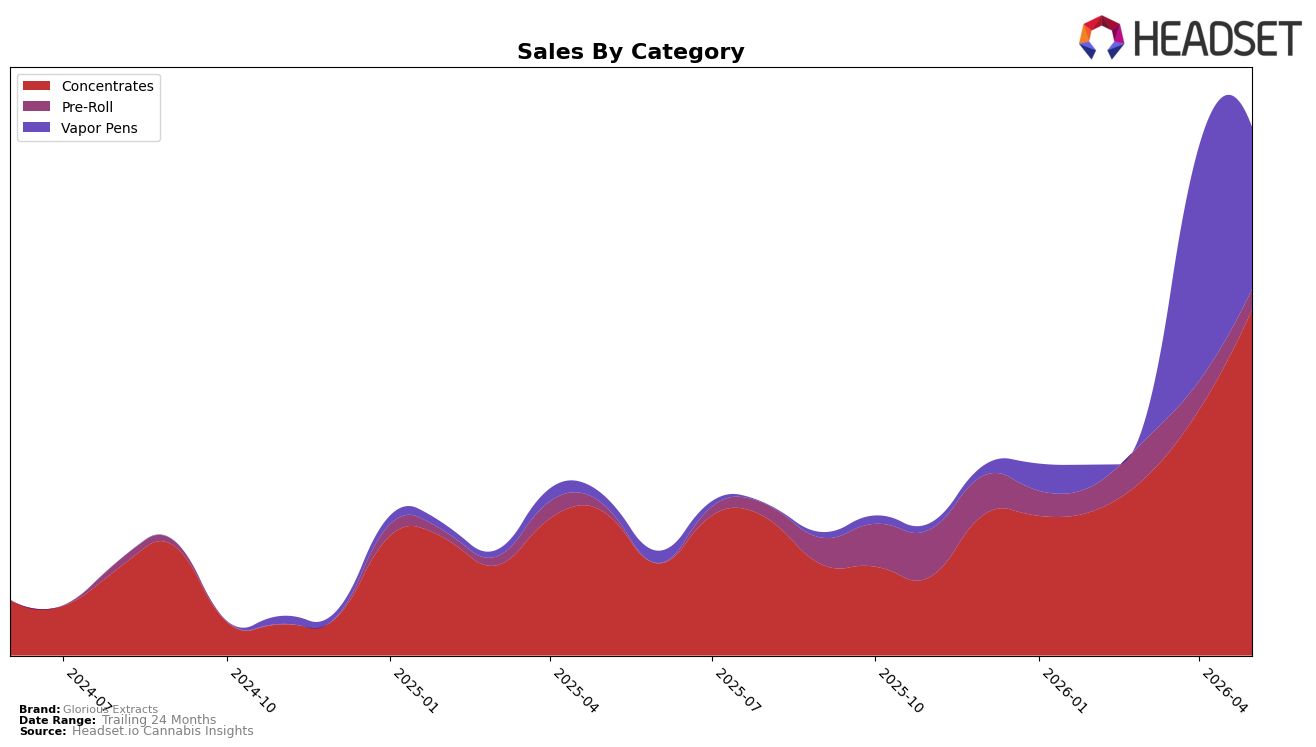
Glorious Extracts concentrated its May 2026 mix in Concentrates at 65.42% share with 140.73% year-over-year growth and 41.13% month-over-month growth, while Vapor Pens held 30.70% share with 1,665.26% year-over-year growth but a 30.78% month-over-month decline. Pre-Roll remained a small 3.88% share, expanding 195.53% year over year yet falling 29.00% month over month. Against this mix, the brand’s overall average price dropped 47.40% year over year to $14.76, and the category with the lowest average price, Concentrates at $12.07, is also where rank sits at position 8 in Arizona Concentrates, indicating volume-led scale concentrated in lower-price segments. The pattern implies Glorious Extracts is leaning into value-driven Concentrates for near-term rank stability while absorbing volatility from Vapor Pens’ rapid year-over-year expansion but sharp month-over-month pullback.
The divergence between accelerating Concentrates month-over-month growth at 41.13% and Vapor Pens’ 30.78% month-over-month contraction, alongside a 230.81% brand-level year-over-year sales increase and a 47.40% year-over-year price decrease, implies the brand is trading price for share, particularly in Concentrates where it holds rank 8 in Arizona. With Vapor Pens contributing nearly one-third of sales at 30.70% share yet showing negative month momentum, the risk is overexposure to a volatile second pillar while the core category advances; meanwhile, Pre-Roll at 3.88% share and a 28.99% month-over-month decline suggests limited ballast for mix stability. The pattern implies near-term positioning as a value-led Concentrates player using price elasticity to defend rank while selectively pruning Vapor Pens volatility to protect margin and sustain share.
Competitive Landscape
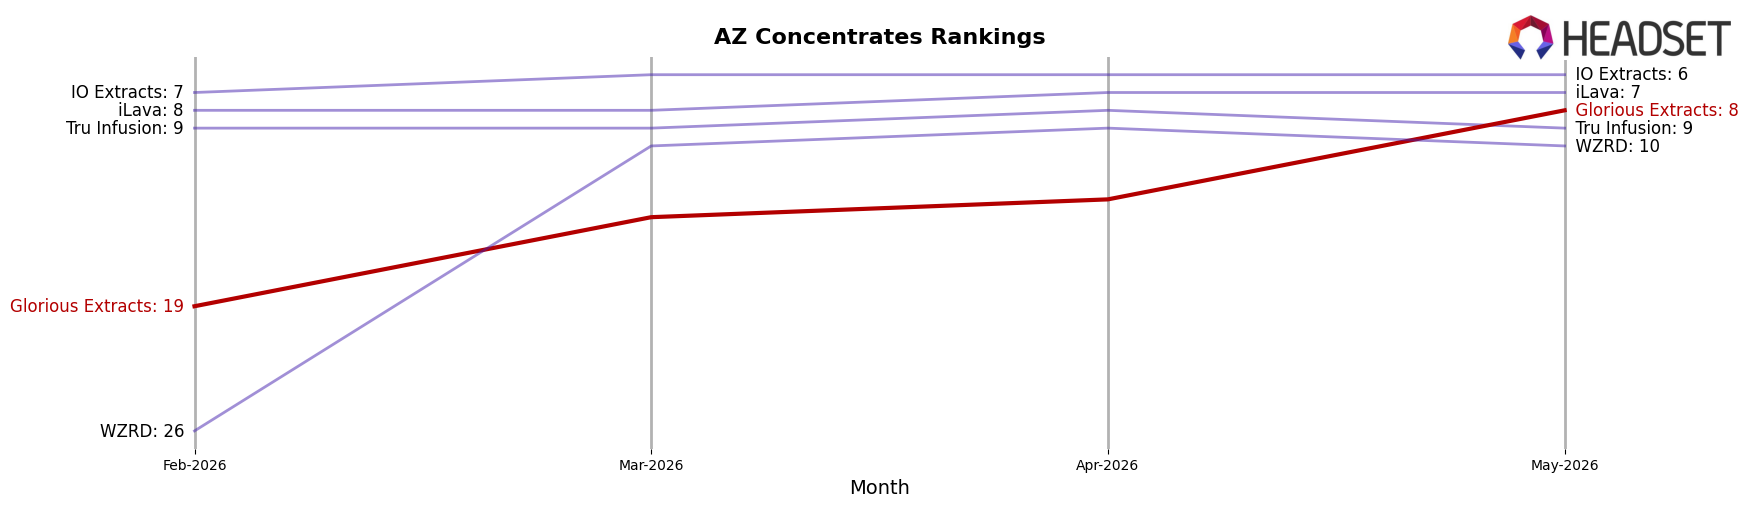
Glorious Extracts is ranked #8 in AZ Concentrates in May 2026, up 20 positions from #28 in May 2025, and has climbed 11 spots from #19 in February 2026 to reach a new peak rank of #8 in May 2026; meanwhile, Mohave Cannabis Co. held #1 year over year despite a 6.2% sales decline and Grow Sciences advanced from #6 to #3 with a 68.1% YoY sales increase, indicating Glorious Extracts’ rapid rank recovery is occurring alongside both leader stability and a mid-tier surge, implying momentum is being built through share capture from the lower half rather than direct displacement of the top two.
Notable Products
Bubbas Headband Cured Budder (1g) posted the largest movement in May 2026 with a +104% month-over-month surge to rank 4, while Headband Cookies Cured Shatter (1g) fell -34.6% to rank 8, indicating volatility within adjacent textures under the Headband lineage. Hells OG Cured Budder (1g) rose +22.3% to rank 2, and Grapefruit Pave Cured Budder (1g) declined -18.4% to rank 9, while four of the top ten are Cured Crumble SKUs concentrated between ranks 3 and 7, pointing to customer preference clustering around crumble and targeted upside for budder-led momentum. Fritter Funk Cured Shatter (1g) held rank 1 with $16,794 in May 2026, contrasted by the absence of comparable MoM data for several crumble SKUs at ranks 3, 5, 6, and 7, which frames the +104% and -34.6% moves as outliers against a stable top tier. The mix implies Glorious Extracts is pivoting toward budder acceleration while keeping shatter as a traffic leader, with crumble depth offering a defensible mid-tier base.
Top Selling Cannabis Brands
Data for this report comes from real-time sales reporting by participating cannabis retailers via their point-of-sale systems, which are linked up with Headset’s business intelligence software. Headset’s data is very reliable, as it comes digitally direct from our partner retailers. However, the potential does exist for misreporting in the instance of duplicates, incorrectly classified products, inaccurate entry of products into point-of-sale systems, or even simple human error at the point of purchase. Thus, there is a slight margin of error to consider. Brands listed on this page are ranked in the top twenty within the market and product category by total retail sales volume.

