May-2026
Sales
Trend
6-Month
Product Count
SKUs
Avg Price
YoY Sales Change
YoY Price Change
Market Insights Snapshot
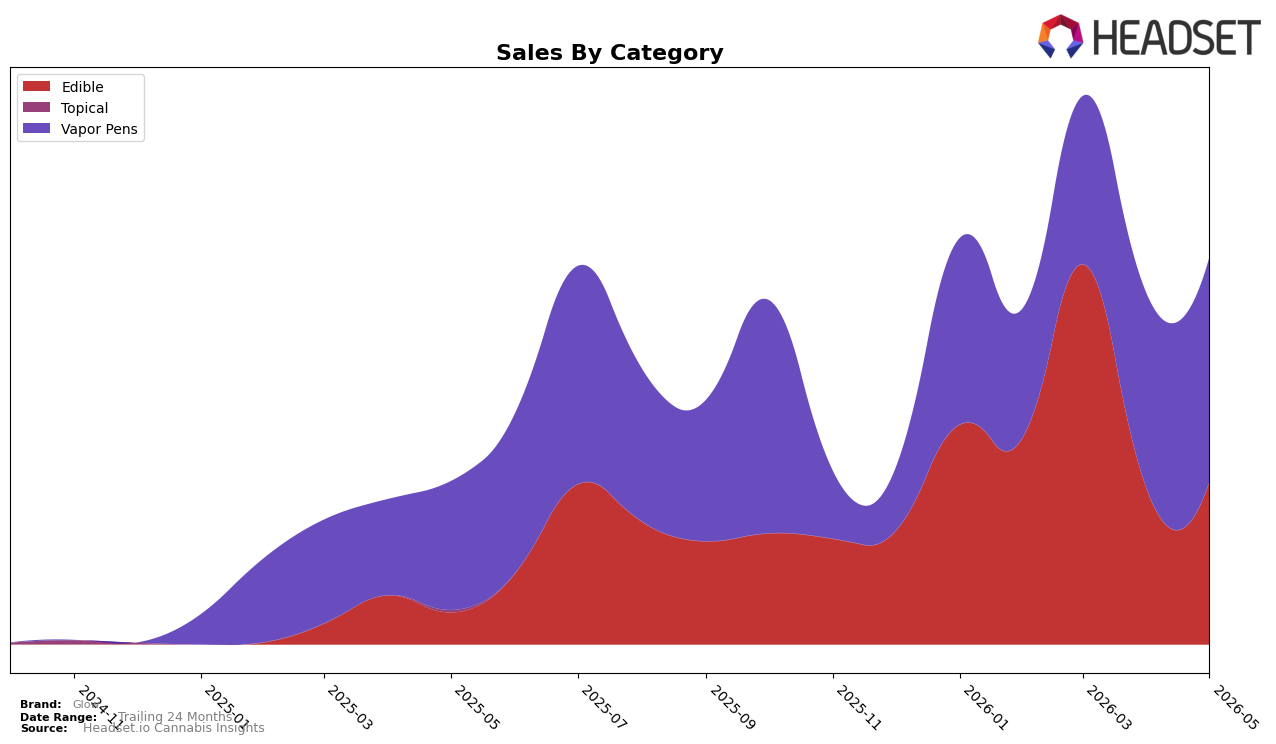
Glow’s May 2026 mix is concentrated in Vapor Pens at 58.0% share with year-over-year growth of 74.5% and month-over-month growth of 15.0%, while Edible holds 42.0% share with a sharper 410.1% year-over-year gain and a 5.4% month-over-month increase. The average price edged up 0.35% year over year to $20.88, with Vapor Pens priced higher at $24.82 versus Edible at $17.12, and the brand’s overall sales expanded 137.9% year over year as rank sat at 50 in Vapor Pens in Maryland. This pattern implies Glide is scaling volume primarily through Edible’s faster YoY expansion while using Vapor Pens’ larger base and higher price point to anchor revenue and maintain visibility despite a lower category rank position.
The split—58.0% share in Vapor Pens growing 15.0% MoM versus 42.0% in Edible growing 5.4% MoM—indicates near-term momentum favors Vapor Pens even as Edible drives longer-run YoY mix change at 410.1% versus 74.5%. With average pricing up just 0.35% YoY against triple-digit sales growth of 137.9%, the lift is primarily unit-led, suggesting the brand’s positioning skews toward accessible price tiers in Edible while leaning on premium-leaning Vapor Pens pricing at $24.82 to support margins; the tactical implication is to defend Vapor Pens shelf presence to capture MoM velocity while allocating incremental activation to Edible to convert its outsized YoY demand into sustained share.
Competitive Landscape
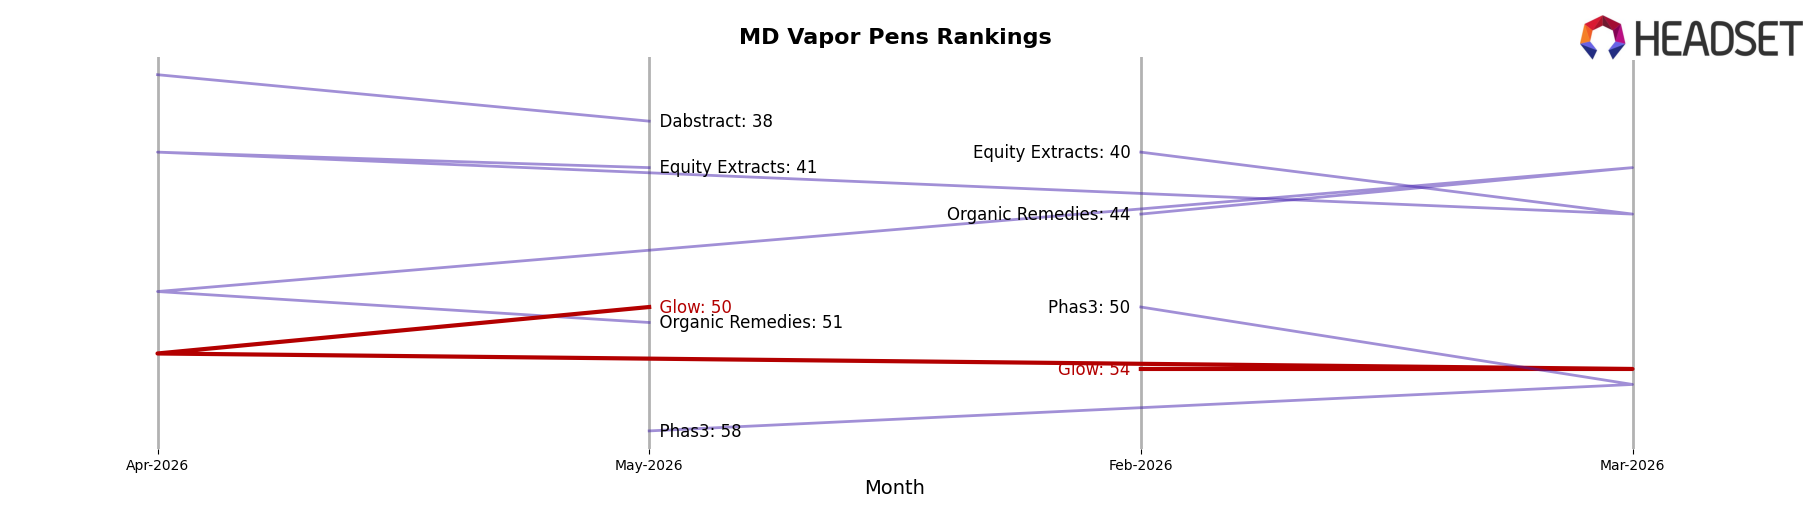
Glow sits at rank #50 in May 2026, a 3-position improvement from #53 year over year and a 4-position climb from #54 in February 2026, marking its peak rank to date at #50 in May 2026 alongside a zero-position month-over-month change from April 2026 to May 2026. In contrast, Select held #1 with a 0-position YoY change while growing sales by 16.3%, and RYTHM advanced from #4 to #3 year over year with an 18.9% sales increase, whereas Hellavated slipped from #3 to #5 with a YoY rank decline of 2 positions and a 18.9% sales contraction; relative to these shifts, Glow’s incremental rank gains suggest a foothold built on gradual share capture rather than volume acceleration, implying that sustaining small rank wins amid top-tier stability will likely require targeted moves against mid-pack brands losing ground.
Notable Products
Feeling Punchy Chews 10-Pack (100mg) delivered the headline move in May 2026 with a +245.6% MoM surge into rank 7, while Island Vibes Gummies 10-Pack (100mg) fell -34.6% to rank 3. Glow Getter Live Terps Cartridge (0.5g) slipped -15.7% yet held rank 1, and Washington County Cookies Full Spectrum Disposable (0.5g) jumped +196.9% to rank 5 with $5,302 in sales. With two Vapor Pens in the top five and three Edibles in the top seven, the mix points to Glow leaning into a barbell of value-seeking Edibles volatility and recovering Vapor Pen traction to balance category risk.
Top Selling Cannabis Brands
Data for this report comes from real-time sales reporting by participating cannabis retailers via their point-of-sale systems, which are linked up with Headset’s business intelligence software. Headset’s data is very reliable, as it comes digitally direct from our partner retailers. However, the potential does exist for misreporting in the instance of duplicates, incorrectly classified products, inaccurate entry of products into point-of-sale systems, or even simple human error at the point of purchase. Thus, there is a slight margin of error to consider. Brands listed on this page are ranked in the top twenty within the market and product category by total retail sales volume.

