.svg)

Aug-2026
Sales
Trend
6-Month
Product Count
SKUs
Avg Price
YoY Sales Change
YoY Price Change


Where to Buy
GO2 is stocked at 47 licensed dispensaries across New Jersey, with the deepest coverage in Atlantic City, Bloomfield, Fort Lee, Jersey City, and Newark. Search by ZIP code or city below to find the closest one, or filter by product type if you are after a specific format.
Market Insights Snapshot

In August 2026, GO2’s mix concentrated in Flower at 78.93% share (ranked 49 in Flower in New Jersey), with Pre-Roll at 21.07% share. Flower sales rose 68.66% month over month but fell 22.63% year over year, while Pre-Roll climbed 29.19% month over month with no prior-year comp; together these shifts offset a brand-level sales decline of 1.97% year over year and coincided with a 66.44% year-over-year drop in average price. The pattern implies a pivot toward volume-led recovery in August 2026, with a heavier reliance on Flower to regain monthly momentum while price compression narrows year-over-year topline.
The mix and pricing indicate a repositioning toward accessibility: a 66.44% year-over-year price decrease alongside a 68.66% month-over-month Flower rebound suggests volume capture over premium margin, while a 29.19% month-over-month Pre-Roll gain expands entry points at a 6.63 average price. Holding a 78.93% Flower share next to a 21.07% Pre-Roll share implies concentration risk balanced by low-price formats, and the 49 rank in Flower in New Jersey points to headroom if the volume strategy sustains share without further erosive year-over-year pricing.
Competitive Landscape
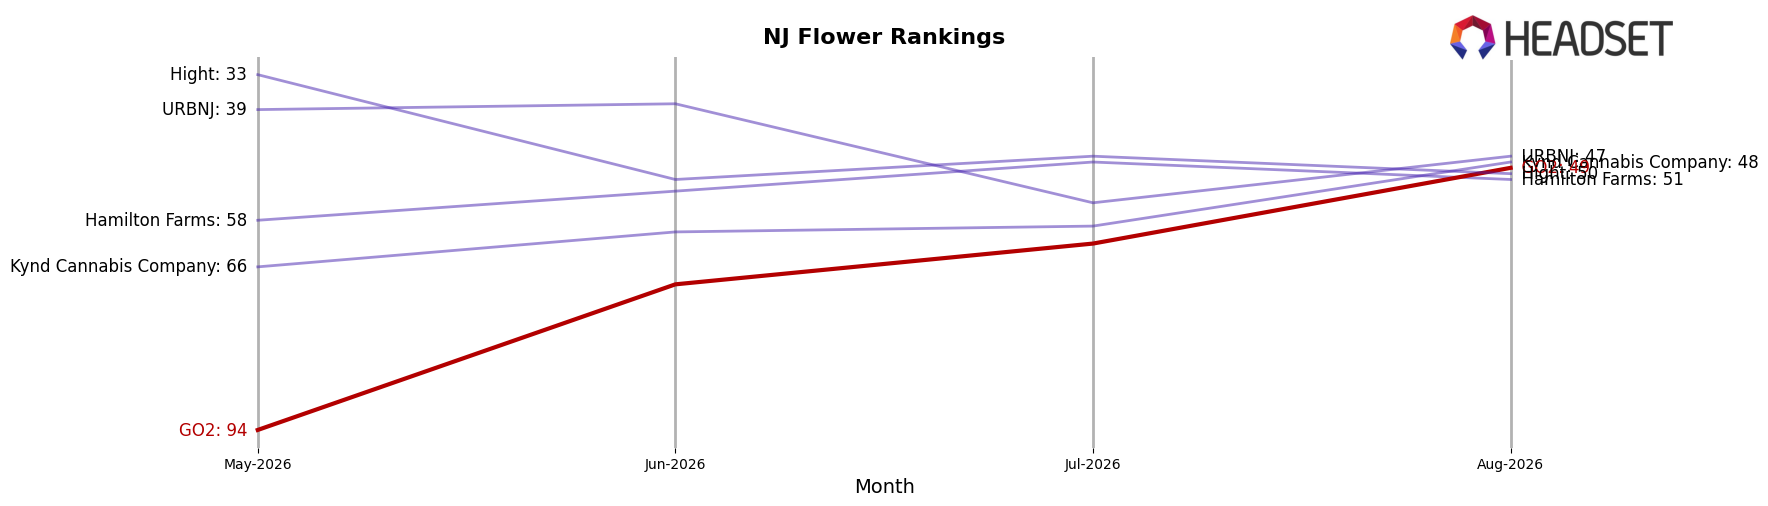
GO2 is currently ranked #49 in New Jersey Flower, down 9 positions versus August 2025 when it ranked #40, yet up 45 positions from May–July’s three‑month trough at #94, indicating recent recovery after a deeper mid‑year slide; by contrast, Ozone sits at #1 after slipping from #2 year over year while posting an 18.5% YoY sales decline, and Find. advanced from #5 to #2 with 40.5% YoY growth, showing that GO2’s path back from a peak of #37 in April 2025 will require capturing share from peers both falling from higher ranks and accelerating from mid‑tier positions, implying a volatile but open lane for incremental rank gains if the recent climb from #94 to #49 persists.
Notable Products
Sour Nerdz Pre-Roll (1g) delivered the standout move in August 2026 with a +131.5% MoM surge into rank 2, while Violet Vixen Smalls (3.5g) also leapt +116.9% to rank 4, and Violet Vixen Pre-Roll (1g) simultaneously fell -59.3% to rank 6; this divergence points to a trade-up from branded pre-rolls toward higher-value formats. Shake (7g) held rank 1 with +22.6% MoM and approximately $67,937 in sales, and six of the top ten were Pre-Roll SKUs, indicating a concentrated basket even as the largest growth came from a Flower smalls SKU; the mix implies GO2 is pivoting from a single value-workhorse toward a two-pillar strategy balancing bulk Flower and selective premiumizations within Pre-Roll.
Top Selling Cannabis Brands






Data for this report comes from real-time sales reporting by participating cannabis retailers via their point-of-sale systems, which are linked up with Headset’s business intelligence software. Headset’s data is very reliable, as it comes digitally direct from our partner retailers. However, the potential does exist for misreporting in the instance of duplicates, incorrectly classified products, inaccurate entry of products into point-of-sale systems, or even simple human error at the point of purchase. Thus, there is a slight margin of error to consider. Brands listed on this page are ranked in the top twenty within the market and product category by total retail sales volume.

