Market Insights Snapshot
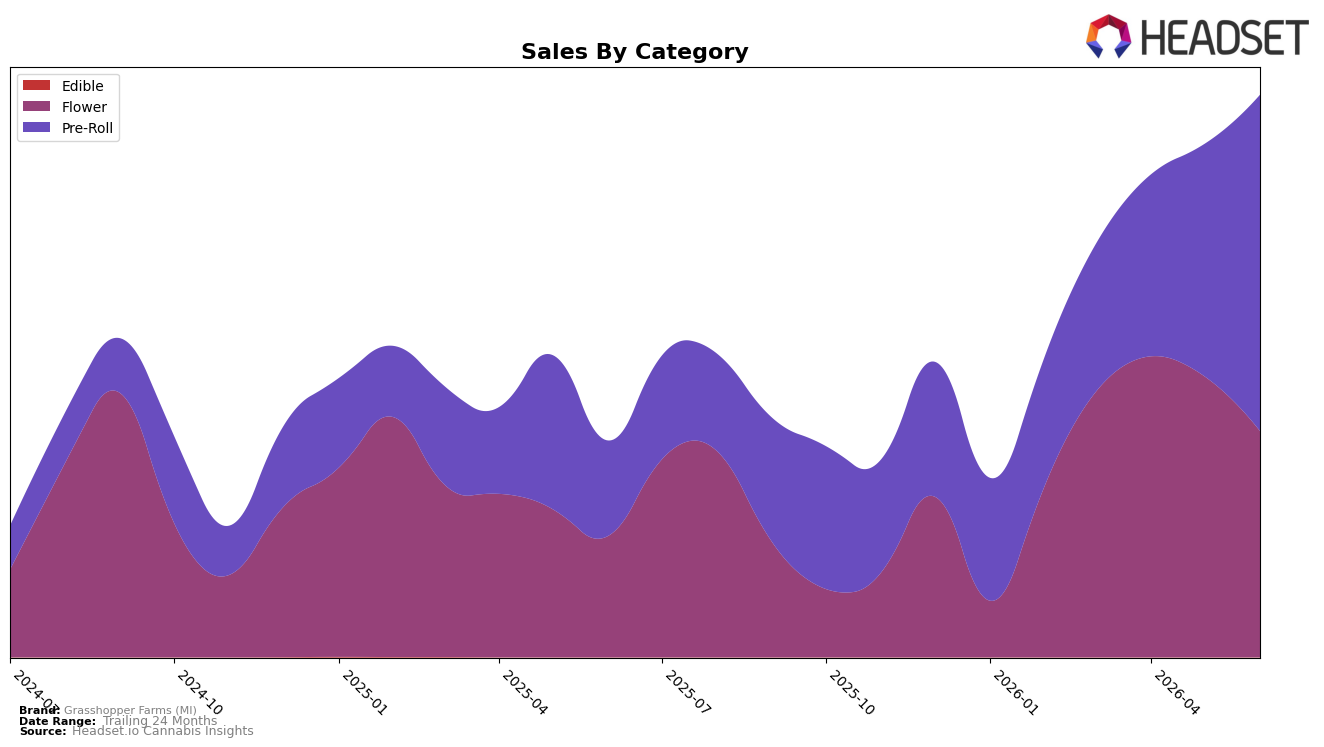
In June 2026, Grasshopper Farms (MI) concentrated 59.79% of sales in Pre-Roll with year-over-year growth of 253.35% and month-over-month growth of 44.60%, while Flower held 40.21% share with year-over-year growth of 86.59% but a month-over-month decline of 19.46%. The brand’s average price rose 26.52% year over year to $5.74, with Pre-Roll priced at $5.17 and Flower at $6.85, indicating mix-driven pricing effects alongside category-specific velocity changes. The combined pattern — Pre-Roll acceleration MoM alongside Flower contraction MoM — implies a reallocation of demand toward lower-priced Pre-Roll units that expand total volume, shaping the brand’s sales surge of 159.94% year over year in MI.
With Pre-Roll now the largest contributor at 59.79% and ranked 13th in Michigan Pre-Roll, the 44.60% MoM gain positions the brand to lean into a value-forward, high-frequency purchase lane, while the 19.46% MoM decline in Flower suggests selective deprioritization or substitution. The 26.52% YoY price lift alongside a 253.35% YoY Pre-Roll expansion indicates pricing power without dampening unit movement, which implies headroom to optimize pack architecture and maintain momentum where rank 13 signals room for share capture through targeted assortment and promotional cadence.
Competitive Landscape
Grasshopper Farms (MI) sits at rank #13 in MI Pre-Roll for June 2026 after climbing 38 positions year over year from #51, and it advanced 16 spots versus March 2026 when it was #29; this also marks a peak rank at #13 in June 2026 and places the brand outside the top 10 while the category leaders held steady. Against competitors, Jeeter held #1 both year over year and in June 2026 while its sales declined 7.9% YoY, and Mitten Extracts moved up from #8 to #4 on 114.4% YoY sales growth; the directional gap implies Grasshopper Farms (MI)’s rank trajectory is improving quickly but must convert gains from #29 to #13 into sustained top-10 penetration as leaders consolidate at #1–#4.

Notable Products
Apple Jacks Haze Infused Pre-Roll (1g) led the month with a steep -13.1% MoM slide while still holding rank 1, and Grape Infused Pre-Roll (1g) rose +14.0% to rank 3, indicating mix pressure at the top even as second-tier infused SKUs gained share. Lifted Lemon Lime Infused Pre-Roll (1g) added +12.7% MoM yet sat at rank 7, while four of the top ten were Flower bulk SKUs clustered at ranks 2, 4, 5, and 6, suggesting volume breadth without MoM momentum. With infused Pre-Rolls occupying ranks 1, 3, 7, 8, and 9 but splitting growth between declines and low-teens gains, the pattern implies Grasshopper Farms (MI) is leaning into infused formats for headline positions while bulk Flower sustains basket depth, a direction that favors high-visibility SKUs over consistent month-to-month velocity.
Top Selling Cannabis Brands
Data for this report comes from real-time sales reporting by participating cannabis retailers via their point-of-sale systems, which are linked up with Headset’s business intelligence software. Headset’s data is very reliable, as it comes digitally direct from our partner retailers. However, the potential does exist for misreporting in the instance of duplicates, incorrectly classified products, inaccurate entry of products into point-of-sale systems, or even simple human error at the point of purchase. Thus, there is a slight margin of error to consider. Brands listed on this page are ranked in the top twenty within the market and product category by total retail sales volume.

