.svg)

Sep-2026
Sales
Trend
6-Month
Product Count
SKUs
Avg Price
YoY Sales Change
YoY Price Change


Where to Buy
Green State is stocked at 46 licensed dispensaries across Washington, with the deepest coverage in Tacoma, Bellevue, Everett, Seattle, and Olympia. Search by ZIP code or city below to find the closest one, or filter by product type if you are after a specific format.
Market Insights Snapshot
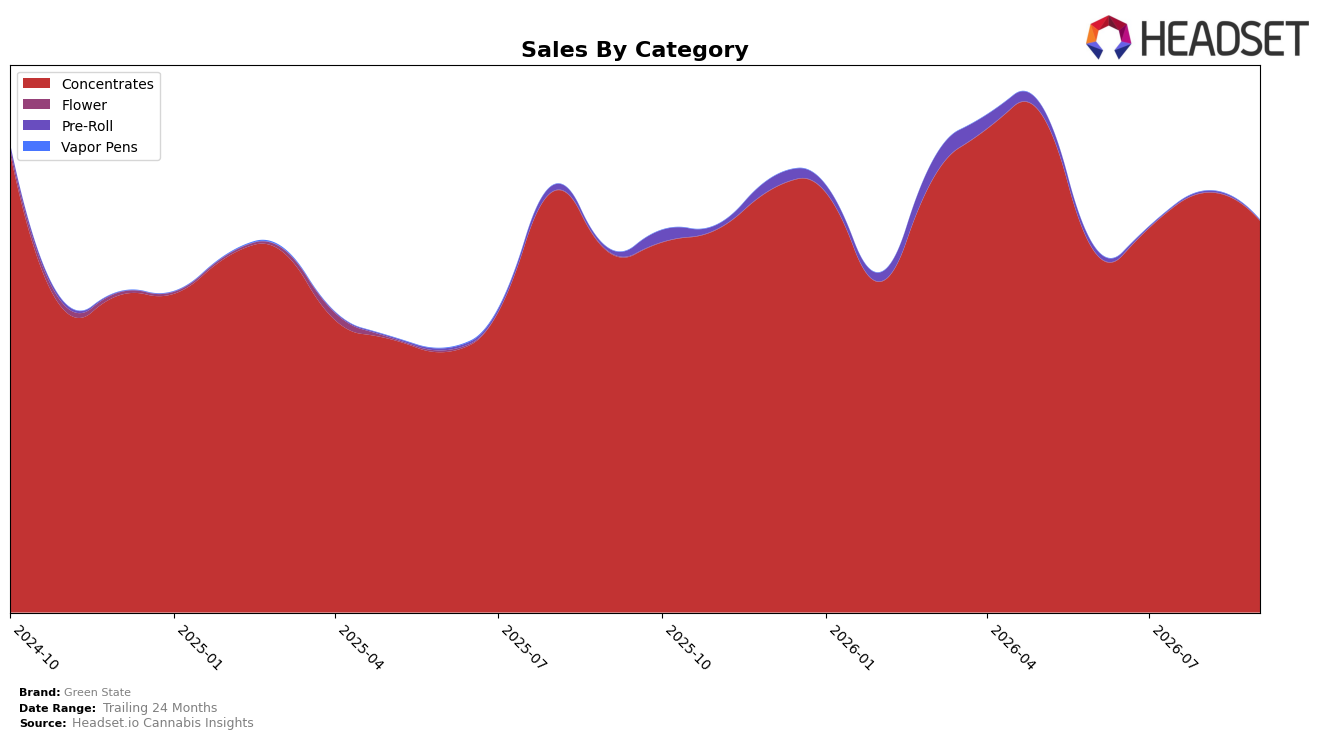
In September 2026, Green State concentrated 99.97% of sales in Concentrates while Pre-Roll held 0.03%, indicating a near single-category footprint; within that, Concentrates grew 8.66% year over year but declined 6.67% month over month, and Pre-Roll contracted 95.33% year over year with an 88.02% month-over-month drop. With average price up 3.26% year over year against overall brand sales growth of 7.79% year over year, mix-driven volume likely carried most of the annual lift as the category skew intensified; the month-over-month slide in the dominant category alongside a 0.03% tail category share implies vulnerability to short-term demand shifts despite year-over-year expansion.
Given a rank of 31 in Concentrates in Washington and a 24-month sales change of -17.07%, the brand’s reliance on a single category caps headroom versus peers that are more diversified; the 8.66% year-over-year gain in the core alongside a 6.67% month-over-month decline signals sensitivity to intra-quarter volatility and promotional cycles. The combination of a 99.97% category share and a 3.26% rise in average price suggests current positioning is price-tolerant within Concentrates but exposed to rank pressure if monthly declines persist, implying the next share point is more likely to come from stabilizing Concentrates velocity than from scaling the 0.03% Pre-Roll niche.
Competitive Landscape
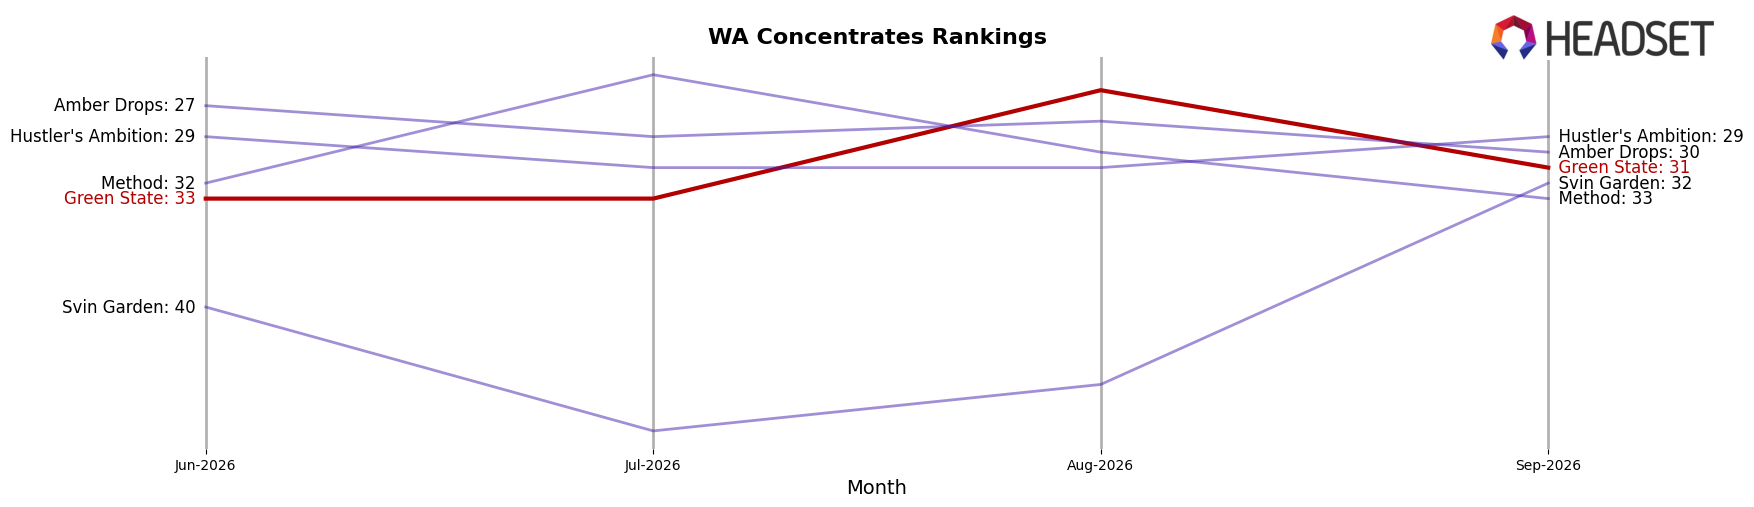
Green State is ranked #31 in WA Concentrates in September 2026, improving 2 positions from #33 year over year, yet still 9 spots below its peak of #22 reached in May 2026; over the last three months it held #33 before the latest 2-rank gain. At the top end, Ooowee held #1 year over year but with sales down 7.8%, while Constellation Cannabis advanced from #11 to #5 on an 88.8% sales increase, and Buddy Boy Farms surged from #49 to #4 with a 464.5% lift, indicating competitors are moving multiple ranks faster than Green State’s 2-position YoY change. The pattern implies Green State’s modest upward rank shift is being outpaced by rapid climbers in the tier above, signaling that without a step-change in velocity the brand risks being boxed out of the top-25 corridor.
Notable Products
Jabba OG Hash Rosin (1g) posted the standout move in September 2026 with a 76.6% month-over-month increase, jumping into rank 4, while Tangie Cookies Hash Rosin (1g) fell 24.4% and slipped to a tie at rank 5. Strawberry Zlurpee Hash Rosin (1g) also surged 51.0% to rank 2, and Garlic Cookies Hash Rosin (1g) held rank 1 with a 27.0% lift and approximately $9.4K in sales. With all ten top SKUs in Concentrates and multiple Cookies-named variants occupying ranks 1, 2, and 5, the mix points to deeper commitment to high-rotation hash rosin flavors and fewer bets on breadth outside the category.
Top Selling Cannabis Brands






Data for this report comes from real-time sales reporting by participating cannabis retailers via their point-of-sale systems, which are linked up with Headset’s business intelligence software. Headset’s data is very reliable, as it comes digitally direct from our partner retailers. However, the potential does exist for misreporting in the instance of duplicates, incorrectly classified products, inaccurate entry of products into point-of-sale systems, or even simple human error at the point of purchase. Thus, there is a slight margin of error to consider. Brands listed on this page are ranked in the top twenty within the market and product category by total retail sales volume.

