.svg)

Sep-2026
Sales
Trend
6-Month
Product Count
SKUs
Avg Price
YoY Sales Change
YoY Price Change


Where to Buy
Lifted Cannabis Co is stocked at 216 licensed dispensaries across Washington, Oregon, and 2 other states, 181 of them in Washington, with the deepest coverage in Seattle, Tacoma, Spokane, Everett, and Lynnwood. Search by ZIP code or city below to find the closest one, or filter by product type if you are after a specific format.
Market Insights Snapshot
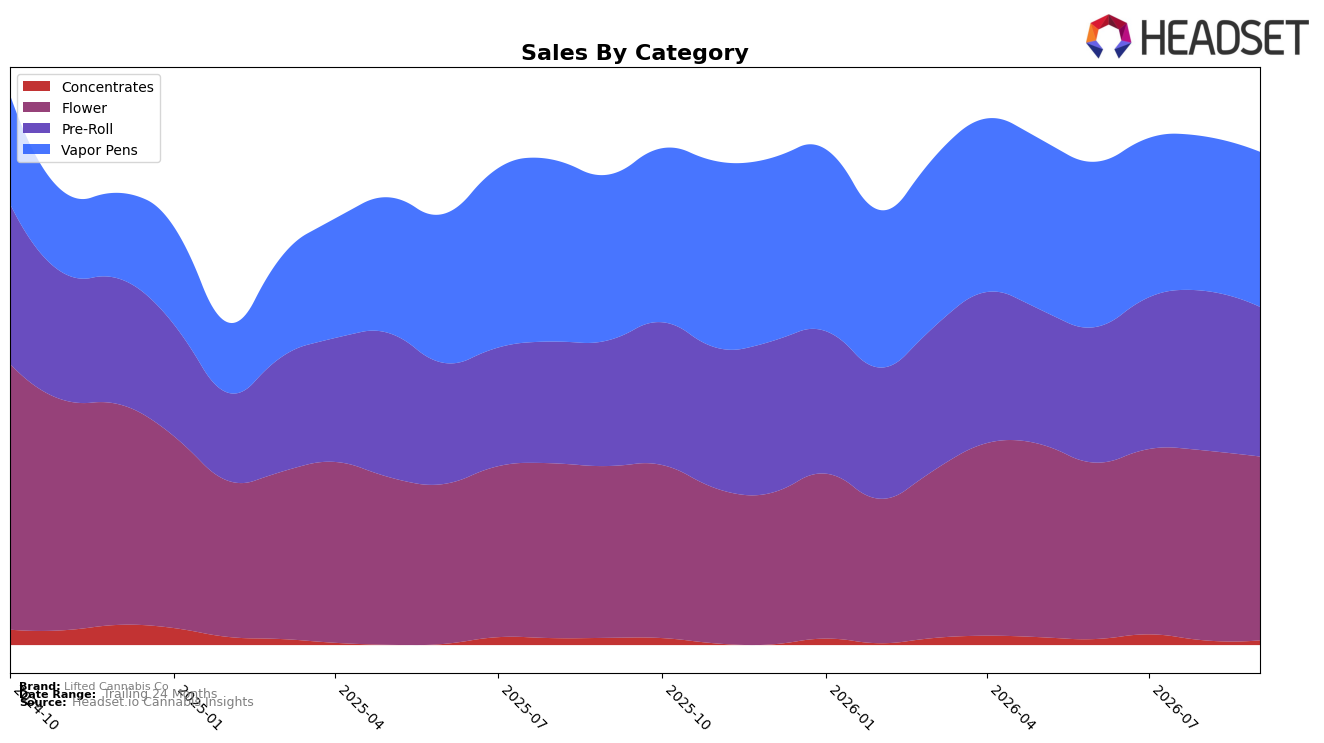
Lifted Cannabis Co concentrated revenue in Flower at 35.54% share with 6.27% year-over-year growth but a 2.88% month-over-month dip, while Pre-Roll held 29.58% share with 16.35% year-over-year growth yet a 5.54% month-over-month pullback; Vapor Pens accounted for 30.53% share with a 5.69% year-over-year decline but a 0.35% month-over-month uptick. Concentrates remained small at 4.34% share with a 9.20% year-over-year decline and effectively flat month-over-month at 0.00%. With brand-level sales up 4.14% year over year and average price down 4.70%, the pattern implies volume-led momentum centered on Flower and Pre-Roll, partially offset by Vapor Pens and Concentrates softness, and a tactical lean into value at an average price of $17.67 in Washington.
Given a number 4 rank in Flower in Washington, the 6.27% year-over-year Flower growth alongside a 2.88% month-over-month slip suggests short-term share vulnerability if the pullback persists, while the 16.35% year-over-year gain in Pre-Roll combined with a 5.54% month-over-month decline points to a demand mix sensitive to promotional cadence and strain rotation. Meanwhile, a 5.69% year-over-year decline but 0.35% month-over-month lift in Vapor Pens indicates stabilization potential that could relieve dependence on Flower’s rank position; overall, the mix shift and 4.70% average price compression imply the brand is competing on accessible price tiers to protect rank in Flower while using Pre-Roll as a growth hedge.
Competitive Landscape
Lifted Cannabis Co sits at rank #4 in Washington Flower in September 2026, improving 2 positions year over year from #6 while slipping 1 place quarter-over-quarter from a peak of #3 reached in June 2026; meanwhile, Phat Panda held #1 both year over year and currently with sales up 18.99%, and Mama J's edged up from #4 to #3 as Legends remained static at #2 despite a 16.90% sales decline. The competitive pressure is intensifying below the top tier as Hemp Kings surged from #24 to #5 on 105.09% YoY sales growth while Lifted Cannabis Co moved from #3 to #4 since June 2026, implying that maintaining share will require defending against fast-rising challengers even as the brand sustains a higher YoY rank baseline.

Notable Products
Sugar Stix - Rizz Infused Pre-Roll (1g) posted the largest month-over-month swing at +65.3% while climbing to rank 4, contrasted by SugarStix - Metaverse Infused Pre-Roll (1g) sliding -8.5% at rank 7 and Sugar Stix - Boysenberry Creme Brulee Infused Pre-Roll (1g) dropping -22.6% at rank 8. Wedding Cake (3.5g) held rank 1 with +47.8% MoM and delivered $124,102, while Sugar Stix- Wedding Cake THCa Infused Pre-Roll (1g) surged +887.4% at rank 2, signaling a sharp tilt toward a few high-velocity winners. With seven of the top ten in Pre-Roll, concentration is building around infused formats that either accelerate quickly or retrench, implying Lifted Cannabis Co is skewing assortment toward flavor-driven Pre-Roll momentum while keeping Flower as the traffic-anchor.
Top Selling Cannabis Brands






Data for this report comes from real-time sales reporting by participating cannabis retailers via their point-of-sale systems, which are linked up with Headset’s business intelligence software. Headset’s data is very reliable, as it comes digitally direct from our partner retailers. However, the potential does exist for misreporting in the instance of duplicates, incorrectly classified products, inaccurate entry of products into point-of-sale systems, or even simple human error at the point of purchase. Thus, there is a slight margin of error to consider. Brands listed on this page are ranked in the top twenty within the market and product category by total retail sales volume.

