Oct-2025
Sales
Trend
6-Month
Product Count
SKUs
Avg Price
YoY Sales Change
YoY Price Change
Market Insights Snapshot
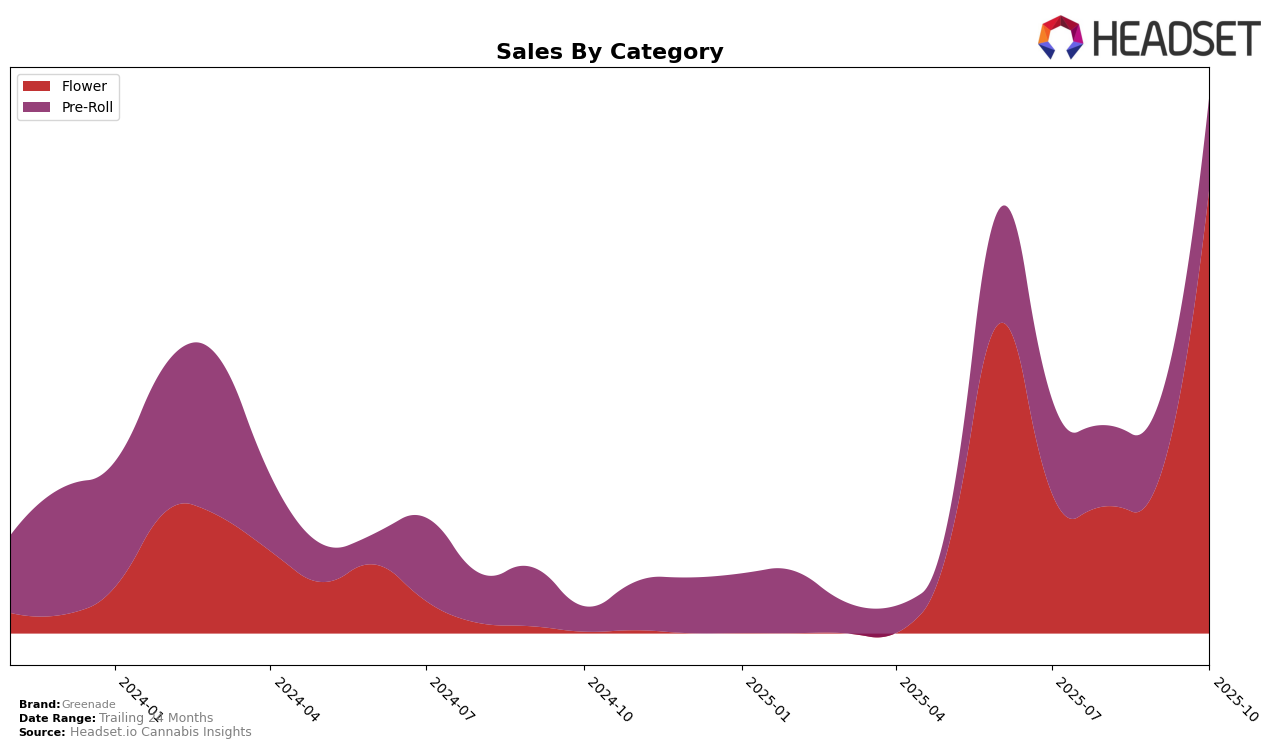
Greenade has exhibited varied performance across different provinces and product categories, with notable movements in the rankings. In Alberta, Greenade's presence in the Flower category has not been strong enough to secure a top 30 position, indicating room for improvement in this segment. Conversely, the Pre-Roll category has seen Greenade consistently ranked, albeit towards the lower end, moving from 86th in July to 97th by October. This downward trend suggests a need for strategic adjustments to regain market share. In contrast, the Flower category in British Columbia tells a different story, with Greenade leaping from 77th place in July to a solid 30th by October, indicating a significant improvement in market penetration and consumer interest.
The sales trajectory in British Columbia for the Flower category is particularly striking, with a substantial increase from July to October, reflecting a growing consumer preference for Greenade products in this region. The Pre-Roll category in Alberta, however, shows a decline in sales over the same period, which aligns with the drop in rankings. This suggests that while Greenade has successfully captured a larger share of the Flower market in British Columbia, its strategy in Alberta, particularly in Pre-Rolls, might require reevaluation to address the declining trend. Understanding these dynamics is crucial for stakeholders looking to optimize Greenade's market positioning across these provinces.
Competitive Landscape
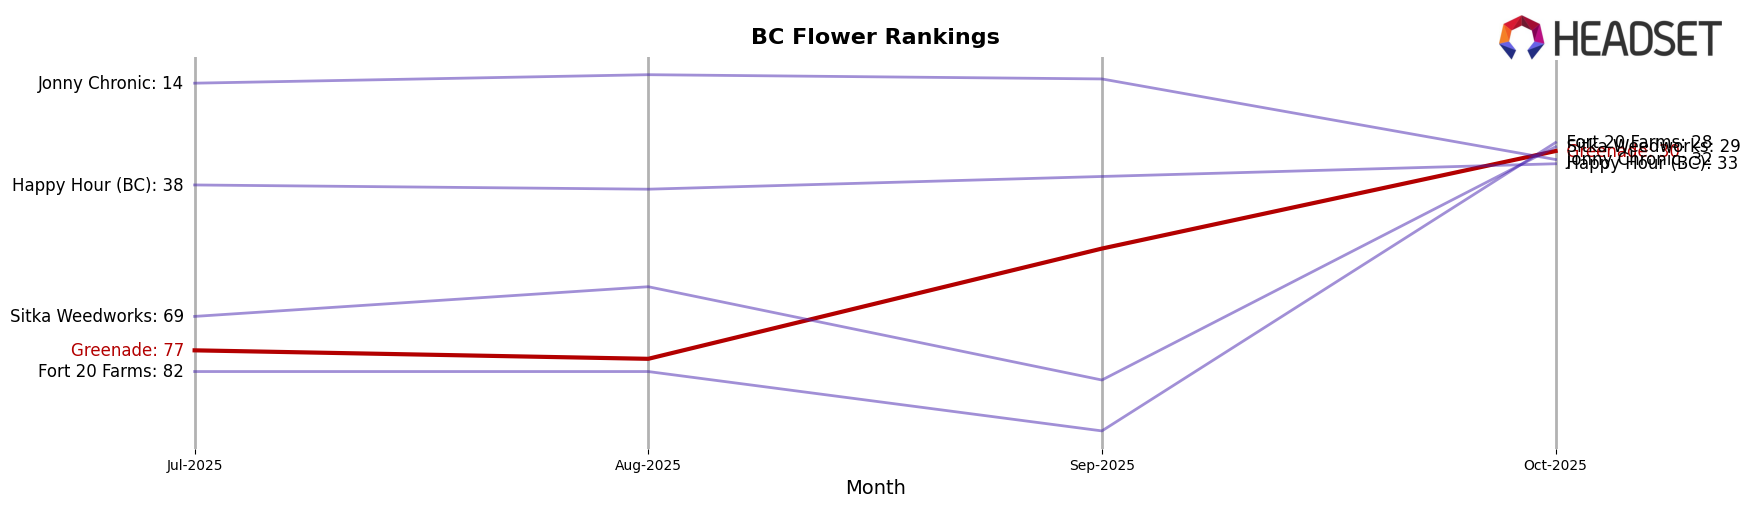
In the competitive landscape of the Flower category in British Columbia, Greenade has shown a remarkable upward trajectory in recent months. Starting from a rank of 77 in July 2025, Greenade has climbed to an impressive 30th position by October 2025. This significant improvement in rank is accompanied by a substantial increase in sales, indicating a growing consumer preference for Greenade products. In contrast, Jonny Chronic, which held a strong position in the top 15 for most of the period, experienced a notable drop to 32nd place in October, suggesting potential challenges in maintaining its market share. Meanwhile, Sitka Weedworks and Fort 20 Farms have also shown fluctuations, with Sitka Weedworks ending slightly ahead of Greenade at 29th, while Fort 20 Farms made a dramatic leap to 28th from being outside the top 80. These shifts highlight a dynamic market environment where Greenade's strategic initiatives appear to be paying off, positioning it as a rising contender in the British Columbia Flower market.
Notable Products
In October 2025, Tropical Skunk (14g) from the Flower category emerged as the top-performing product for Greenade, climbing to the number one rank with impressive sales of 3341 units. The Permanent Kimera Pre-Roll 5-Pack (2.5g) secured the second spot, advancing from its consistent third-place position in September, with sales reaching 1310 units. The Fight Club Pre-Roll 10-Pack (5g), which held the top rank from July to September, slipped to third place in October. Notably, Fight Club (14g) and Fight Club (3.5g) from the Flower category did not rank in October, indicating a shift in consumer preference towards larger pack sizes and pre-rolls. Overall, the rankings highlight a significant rise in popularity for Tropical Skunk, while Fight Club's dominance in previous months has waned.
Top Selling Cannabis Brands
Data for this report comes from real-time sales reporting by participating cannabis retailers via their point-of-sale systems, which are linked up with Headset’s business intelligence software. Headset’s data is very reliable, as it comes digitally direct from our partner retailers. However, the potential does exist for misreporting in the instance of duplicates, incorrectly classified products, inaccurate entry of products into point-of-sale systems, or even simple human error at the point of purchase. Thus, there is a slight margin of error to consider. Brands listed on this page are ranked in the top twenty within the market and product category by total retail sales volume.

