.svg)

Sep-2026
Sales
Trend
6-Month
Product Count
SKUs
Avg Price
YoY Sales Change
YoY Price Change


Market Insights Snapshot
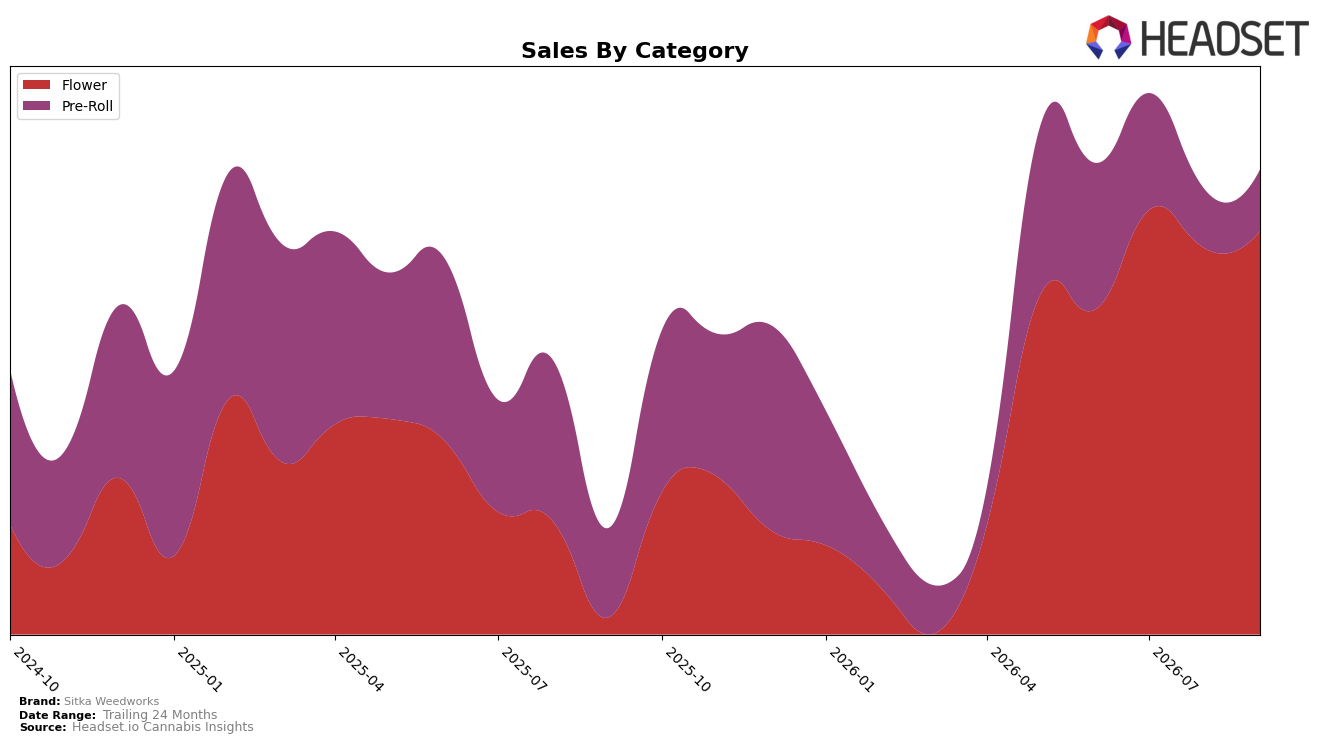
In September 2026, Sitka Weedworks derived 78.24% share from Flower with a 442.93% year-over-year rise and a 3.77% month-over-month gain, while Pre-Roll held 21.76% share with a -17.39% year-over-year decline and a 2.05% month-over-month increase. The average brand price fell 0.33% year over year to $28.36, alongside a category average price of $31.28 in Flower, and the brand held rank 39 in Flower in British Columbia. The pattern implies Sitka Weedworks is consolidating into a Flower-led profile where rapid share expansion in Flower offsets contraction in Pre-Roll, positioning overall growth to hinge on sustaining double- and triple-digit Flower momentum rather than broad-based category balance.
With overall brand sales up 145.36% year over year against a 41.19% two-year growth baseline, the 3.77% month-over-month uplift in Flower versus 2.05% in Pre-Roll suggests near-term mix will tilt further toward Flower as long as price discipline holds near a -0.33% annual price change. Holding rank 39 in Flower in British Columbia while Flower commands 78.24% of sales indicates room to trade rank upward if the brand can translate elevated Flower velocity into distribution or SKU breadth, implying that competitive positioning will be defined more by depth in a single category than by diversification across categories.
Competitive Landscape
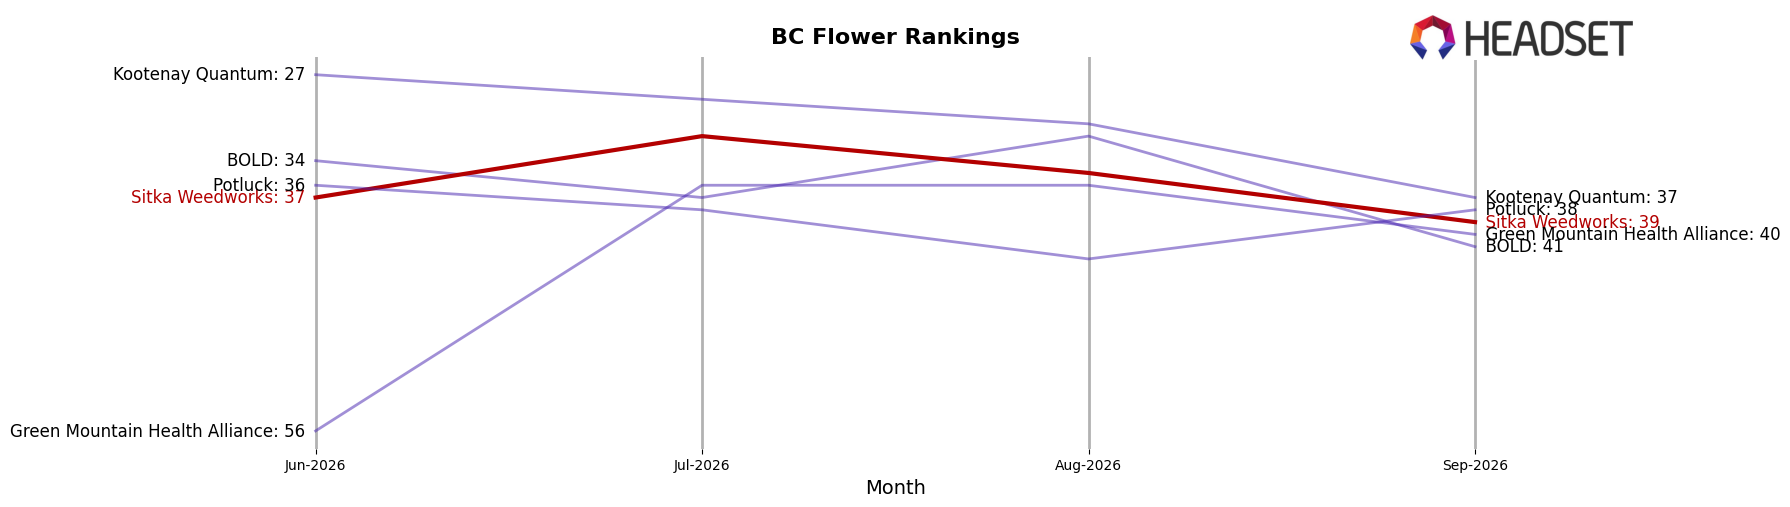
Sitka Weedworks is ranked #39 in BC Flower in September 2026, improving 54 positions year over year from #93 while slipping 2 ranks from June 2026’s #37, and its peak of #32 in July 2026 indicates mid-summer outperformance before a late-quarter fade; meanwhile, Big Bag O' Buds held #1 with a 13.7% year-over-year sales increase and Good Supply moved from #8 to #2 alongside a 59.6% sales lift, signaling that Sitka Weedworks’ rapid year-over-year rank climb has not yet converted into durable top-30 placement against faster-advancing leaders, implying the brand is in recovery but needs sustained monthly gains to avoid oscillation around the high-30s.
Notable Products
Legends - Chimera Junky (7g) posted a 767.5% month-over-month surge to rank 5, while Gas Berry Smalls (3.5g) fell 26.8% to rank 3, indicating a sharp reallocation within Flower toward newly resonant mid-size formats. At the top, Legends - Tahiti Punch Smalls (3.5g) stayed at rank 1 despite a 10.0% decline, and Legends - Sherb Cookies (14g) rose 10.6% at rank 4, so three of the top five are Flower SKUs, concentrating share in that category. Pre-Rolls were mixed, with Legends - Cherry Chatter Pre-Roll 5-Pack (2.5g) up 15.6% at rank 2 while Legends - TKO Pre-Roll (1g) slid 34.0% at rank 9, implying consumer preference for multipacks over singles in September 2026. The product mix points to Sitka Weedworks leaning into Flower depth and pre-roll multipacks, de-emphasizing single-stick and slower legacy Flower formats.
Top Selling Cannabis Brands






Data for this report comes from real-time sales reporting by participating cannabis retailers via their point-of-sale systems, which are linked up with Headset’s business intelligence software. Headset’s data is very reliable, as it comes digitally direct from our partner retailers. However, the potential does exist for misreporting in the instance of duplicates, incorrectly classified products, inaccurate entry of products into point-of-sale systems, or even simple human error at the point of purchase. Thus, there is a slight margin of error to consider. Brands listed on this page are ranked in the top twenty within the market and product category by total retail sales volume.

