.svg)
Aug-2026
Sales
Trend
6-Month
Product Count
SKUs
Avg Price
YoY Sales Change
YoY Price Change


Where to Buy
GreenCo Ventures is stocked at 91 licensed dispensaries across Michigan, with the deepest coverage in New Buffalo, Detroit, Lansing, Monroe, and Adrian. Search by ZIP code or city below to find the closest one, or filter by product type if you are after a specific format.
Market Insights Snapshot
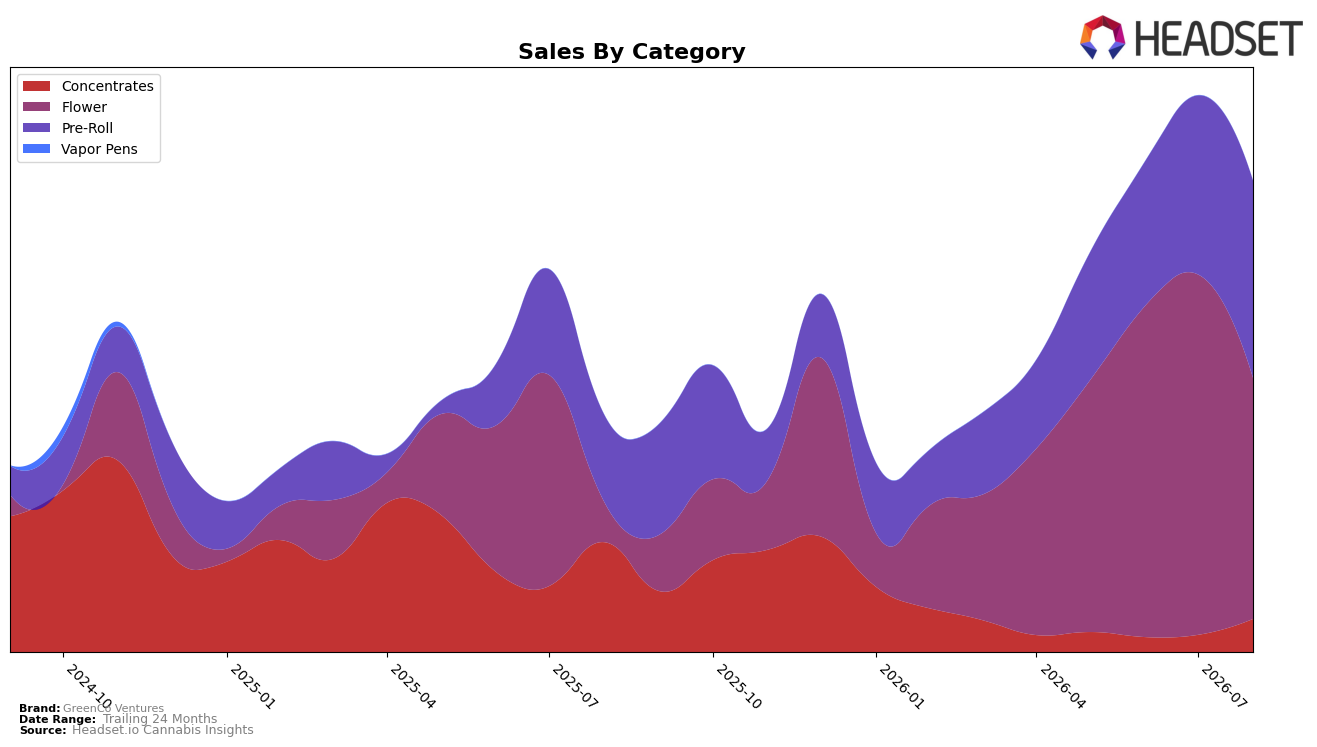
In August 2026, GreenCo Ventures concentrated half of sales in Flower at 50.95% share, with Pre-Roll at 41.99% and Concentrates at 7.05%, indicating a two-category core. Flower delivered 497.26% year-over-year growth but fell 33.55% month-over-month, while Pre-Roll rose 126.46% year-over-year and 10.12% month-over-month; Concentrates declined 69.83% year-over-year but rebounded 93.87% month-over-month. With the brand ranked 68 in Flower in Michigan and average price down 39.31% year-over-year to $3.53, the mix implies a price-led volume shift that lifted total brand sales 98.21% year-over-year but left Flower exposed to short-term volatility.
The combination of a 33.55% month-over-month Flower pullback alongside a 10.12% month-over-month Pre-Roll gain suggests GreenCo Ventures is diversifying demand toward a lower-ticket, higher-velocity lane while cushioning category concentration risk. The 93.87% month-over-month recovery in Concentrates, despite a 69.83% year-over-year decline, indicates opportunistic re-entry potential if price architecture remains lean, and the 51.20% 24‑month sales increase alongside a 39.31% price drop signals that sustained share gains will depend on maintaining sub-premium positioning even as the brand targets a higher rank than 68 in Michigan Flower.
Competitive Landscape
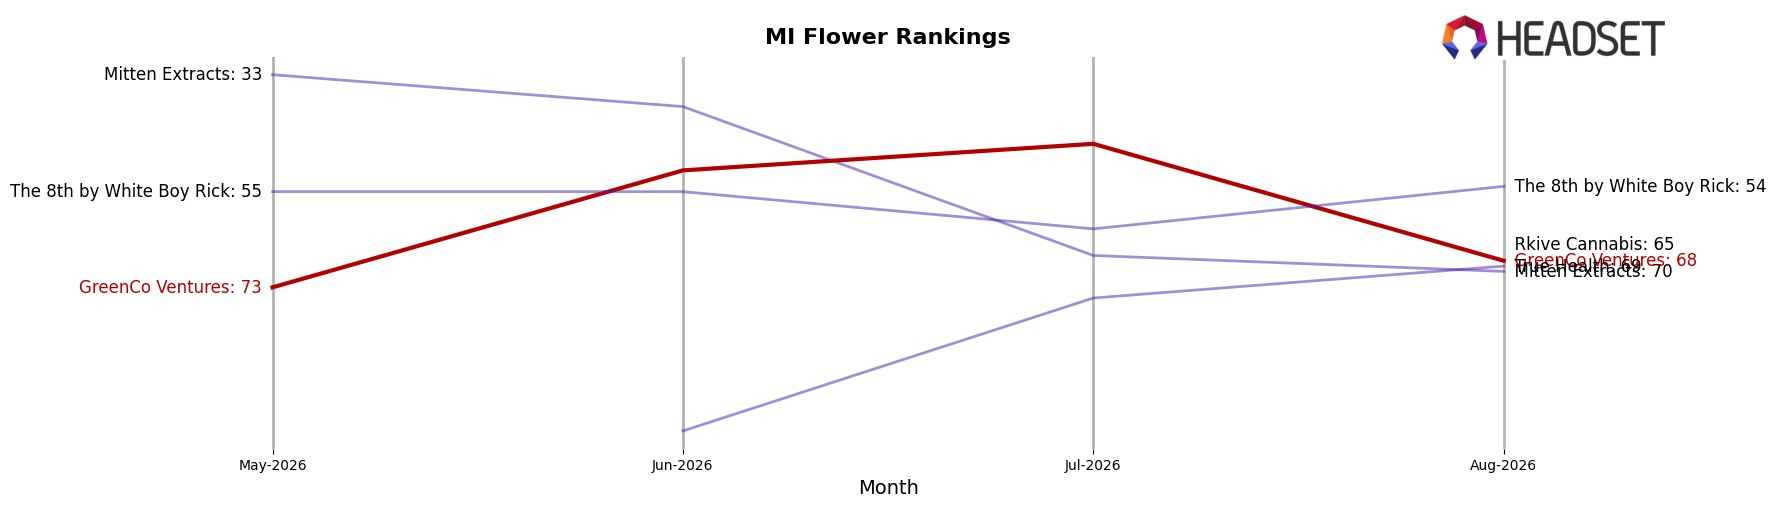
GreenCo Ventures sits at rank #68 in MI Flower for August 2026, improving 164 positions from #232 year over year, and edging up 5 spots from #73 in May 2026 while still trailing its peak at #46 in July 2026; by contrast, High Minded held #1 with a -17.37% YoY sales change and NOBO climbed from #42 to #3 with a 506.83% YoY sales surge, indicating GreenCo Ventures’ ascent is materially slower than the fastest risers but faster than flat or declining leaders. The pattern—quick recovery from triple-digit ranks and a recent pullback from a July 2026 peak—implies GreenCo Ventures is consolidating mid-tier gains rather than breaking into the top 20 without a step-change in velocity.
Notable Products
Blueberry Lemon Shake Up Pre-Roll (1g) posted the largest month-over-month gain at 76.3% and rose to rank 2, while Tropical Pearl Pre-Roll (1g) plunged 62.3% to rank 10, signaling a bifurcation within the lineup. Blue Star OG Infused Pre-Roll (1g) advanced 68.5% to rank 1, contrasting with Cereal Milk Pre-Roll (1g) declining 9.1% at rank 8, and eight of the top ten SKUs are Pre-Roll variants within a concentrated infused format. The combined movement, including one product exceeding $30,000 in August 2026 sales, points to an emphasis on higher-velocity infused Pre-Rolls even as select non-infused entries lose momentum. This pattern implies GreenCo Ventures is consolidating around fast-cycling infused Pre-Rolls while pruning or repositioning slower traditional Pre-Rolls.
Top Selling Cannabis Brands






Data for this report comes from real-time sales reporting by participating cannabis retailers via their point-of-sale systems, which are linked up with Headset’s business intelligence software. Headset’s data is very reliable, as it comes digitally direct from our partner retailers. However, the potential does exist for misreporting in the instance of duplicates, incorrectly classified products, inaccurate entry of products into point-of-sale systems, or even simple human error at the point of purchase. Thus, there is a slight margin of error to consider. Brands listed on this page are ranked in the top twenty within the market and product category by total retail sales volume.

