Feb-2026
Sales
Trend
6-Month
Product Count
SKUs
Avg Price
YoY Sales Change
YoY Price Change
Market Insights Snapshot
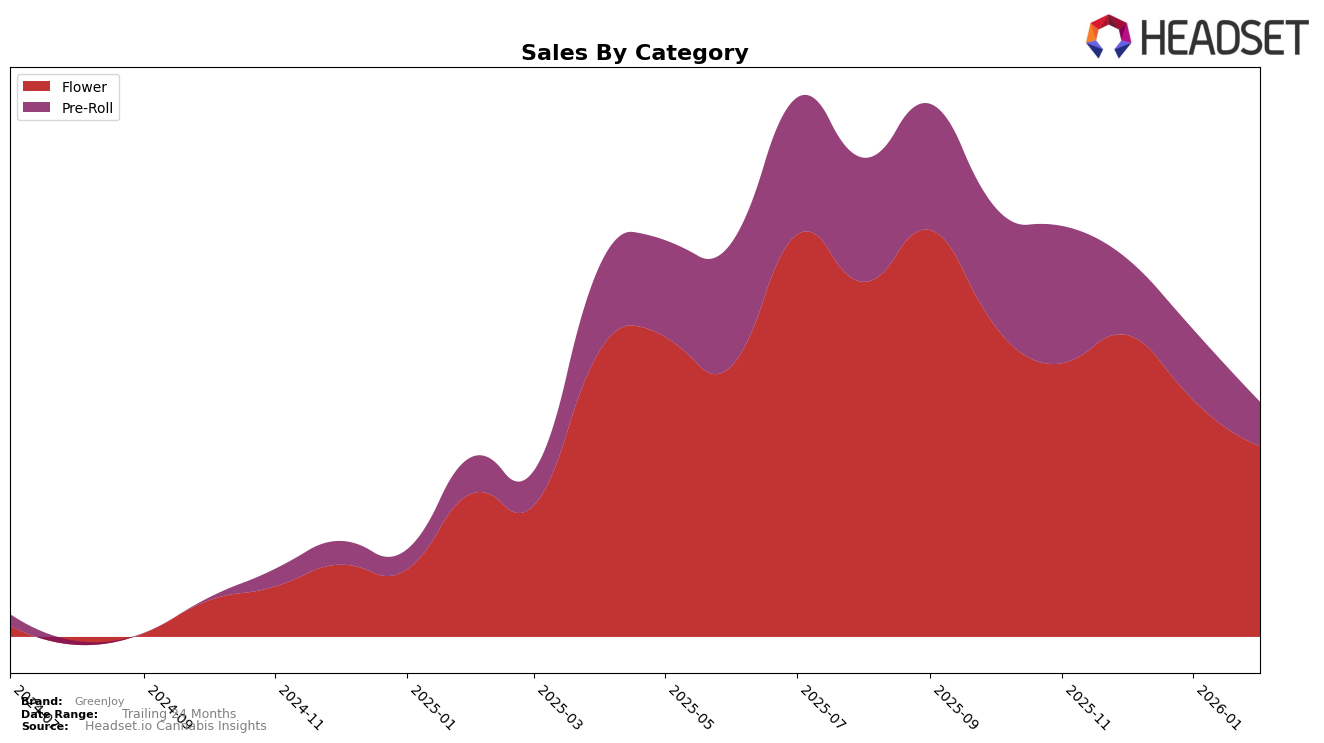
GreenJoy's performance in the state of New Jersey has shown some notable trends across different product categories over recent months. In the Flower category, GreenJoy maintained a presence in the top 30, with a slight dip from 27th in November 2025 to 30th by February 2026. This movement, coupled with a decrease in sales from $521,093 in November to $363,300 in February, suggests a challenging market environment. However, the brand's ability to remain within the top 30 indicates a persistent demand for its Flower products, despite the downward trend in sales figures.
In contrast, GreenJoy's standing in the Pre-Roll category in New Jersey reveals a more concerning pattern. Starting at 16th place in November 2025, the brand slipped out of the top 30 by February 2026. This fall corresponds with a significant decrease in sales, from $261,255 in November to $83,810 in February, highlighting potential challenges in maintaining market share. The absence from the top 30 by February suggests that GreenJoy may need to reassess its strategy in this category to regain competitive positioning.
Competitive Landscape
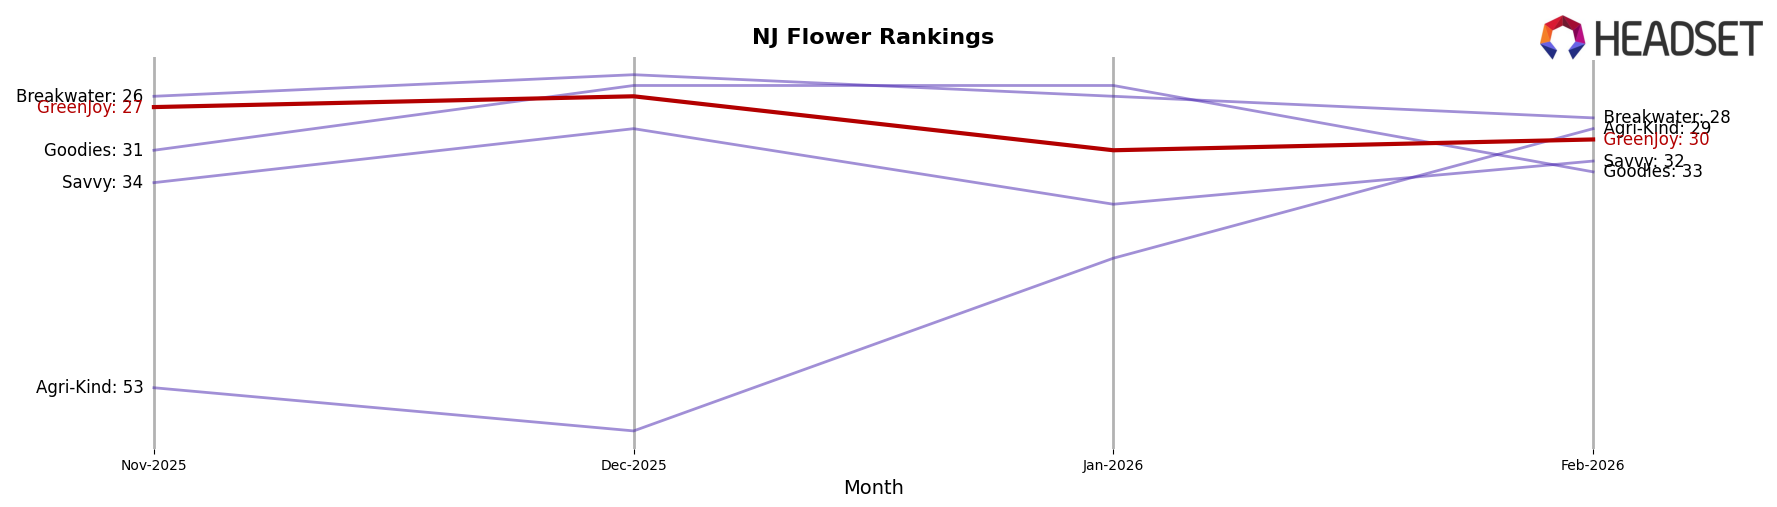
In the competitive landscape of the Flower category in New Jersey, GreenJoy has experienced fluctuations in its ranking over recent months, indicating a dynamic market position. As of February 2026, GreenJoy holds the 30th rank, a slight improvement from January 2026 when it was ranked 31st. This upward movement is notable, especially when compared to competitors such as Agri-Kind, which has shown a more significant climb from 41st to 29th place in the same period. Meanwhile, Goodies and Savvy have experienced a decline, with Goodies dropping from 25th to 33rd and Savvy slightly improving from 36th to 32nd. Breakwater remains a strong competitor, consistently maintaining a top 30 position. These shifts highlight the competitive pressures GreenJoy faces, as well as the opportunities for growth if it can capitalize on the declining momentum of some rivals. The sales trends further emphasize the competitive dynamics, with GreenJoy's sales in February 2026 being lower than in previous months, suggesting a need for strategic adjustments to regain market share.
Notable Products
In February 2026, GreenJoy's top-performing product was Bread and Butter (3.5g) in the Flower category, maintaining its first-place ranking from the previous two months with sales of 3,273 units. Peach Crescendo Pre-Roll 2-Pack (1g) rose to the second position, showing a significant improvement from its fourth-place ranking in January. Slurricane Pre-Roll 2-Pack (1g) dropped to third place, down from second in both December and January. Citron (3.5g) entered the rankings for the first time in February, securing the fourth position. Mimosa Pre-Roll 2-Pack (1g) debuted in the rankings at fifth place, indicating a strong market entry.
Top Selling Cannabis Brands
Data for this report comes from real-time sales reporting by participating cannabis retailers via their point-of-sale systems, which are linked up with Headset’s business intelligence software. Headset’s data is very reliable, as it comes digitally direct from our partner retailers. However, the potential does exist for misreporting in the instance of duplicates, incorrectly classified products, inaccurate entry of products into point-of-sale systems, or even simple human error at the point of purchase. Thus, there is a slight margin of error to consider. Brands listed on this page are ranked in the top twenty within the market and product category by total retail sales volume.

