Nov-2025
Sales
Trend
6-Month
Product Count
SKUs
Avg Price
YoY Sales Change
YoY Price Change
Market Insights Snapshot
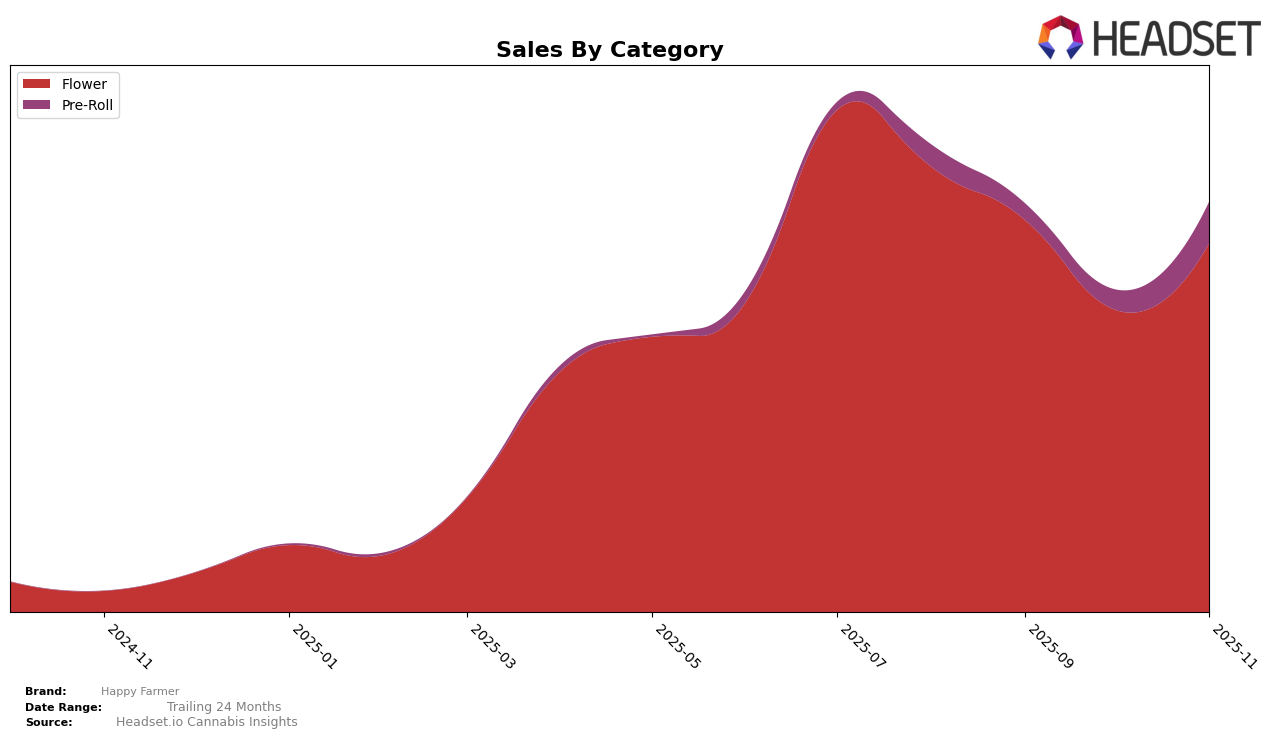
In the state of New Jersey, Happy Farmer has experienced notable shifts in its performance across different cannabis categories. In the Flower category, the brand maintained a steady rank of 23rd in both August and September 2025, but dropped to 31st in October before improving to 27th in November. This fluctuation suggests a competitive market environment and potential challenges in maintaining a top-tier position. Conversely, the Pre-Roll category showed a positive trajectory, with Happy Farmer improving from a rank of 67th in August to 44th by November, indicating a strengthening presence and possibly a successful strategy in this segment. The absence of a top 30 ranking in the Pre-Roll category during the earlier months highlights the significance of this improvement.
Analyzing sales trends, the Flower category in New Jersey saw a decline in sales from August through October, with a recovery in November, aligning with the brand's rank fluctuations. This suggests a potential rebound strategy or market adaptation that could be explored further. In contrast, the Pre-Roll category's sales nearly doubled from September to November, reflecting the brand's upward movement in rankings. This increase in sales volume might point to a successful marketing or product launch, which could be a key area for further investigation. Understanding the dynamics behind these movements could provide valuable insights into Happy Farmer's strategic positioning in New Jersey's cannabis market.
Competitive Landscape
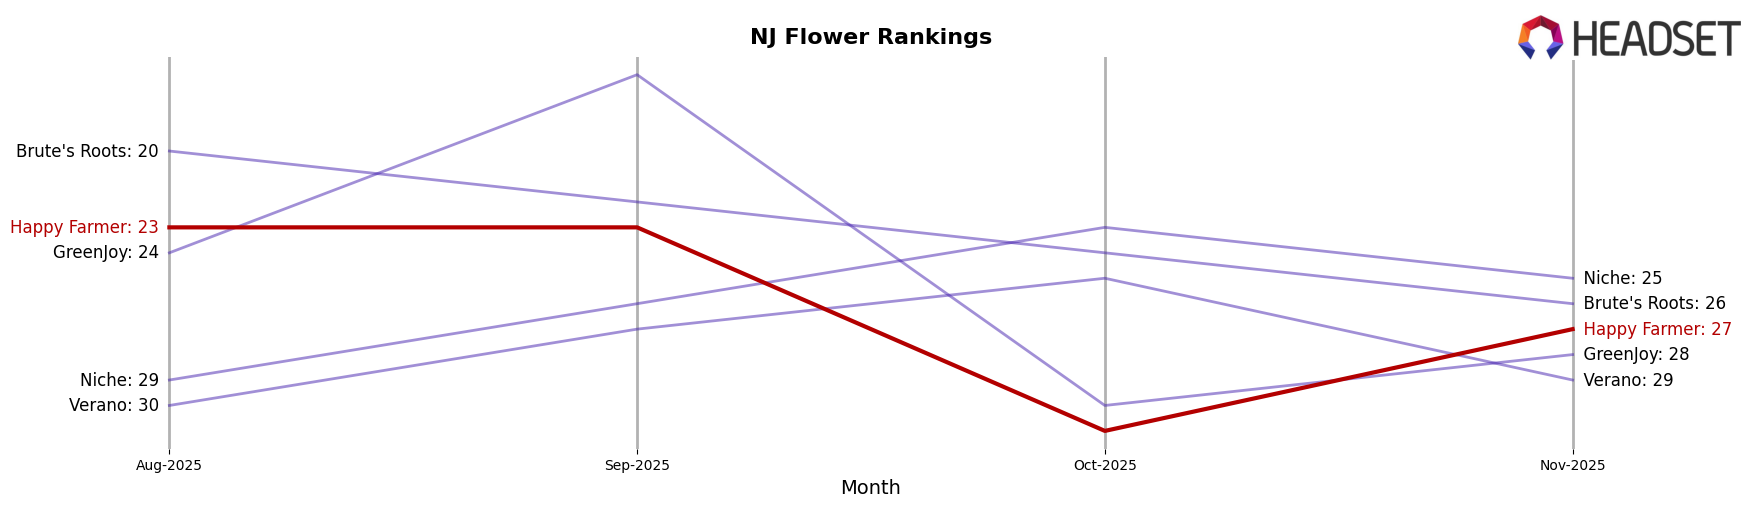
In the competitive landscape of the Flower category in New Jersey, Happy Farmer has experienced notable fluctuations in its market position over the past few months. While maintaining a steady rank of 23 in August and September 2025, Happy Farmer dropped to 31 in October, indicating a temporary dip in its presence among the top brands. However, it rebounded to rank 27 in November, showcasing its resilience and ability to recover. This fluctuation can be attributed to the dynamic performances of competitors such as Brute's Roots and Niche, which have shown relatively stable or improving ranks during the same period. Notably, GreenJoy experienced a significant drop in October, which may have contributed to Happy Farmer's improved rank in November. Despite these challenges, Happy Farmer's sales figures suggest a positive trend, with November sales surpassing those in October, indicating a potential recovery and growth trajectory in the competitive New Jersey Flower market.
Notable Products
In November 2025, Gunpowder Milkshake (3.5g) emerged as the top-performing product for Happy Farmer, climbing from third place in October to first place, with sales reaching 1209 units. Red Velvet Gary (3.5g) maintained its position as the second best-seller, showing consistent performance from the previous month. Doctor Drip Pre-Roll 2-Pack (1g) made a notable debut in the rankings, securing the third spot in its first appearance. Tropical Gelato Pre-Roll 2-Pack (1g) and On Point (3.5g) followed, ranking fourth and fifth respectively, both appearing for the first time in the rankings. This shift in rankings highlights a dynamic change in consumer preferences towards pre-rolls and new flower strains.
Top Selling Cannabis Brands
Data for this report comes from real-time sales reporting by participating cannabis retailers via their point-of-sale systems, which are linked up with Headset’s business intelligence software. Headset’s data is very reliable, as it comes digitally direct from our partner retailers. However, the potential does exist for misreporting in the instance of duplicates, incorrectly classified products, inaccurate entry of products into point-of-sale systems, or even simple human error at the point of purchase. Thus, there is a slight margin of error to consider. Brands listed on this page are ranked in the top twenty within the market and product category by total retail sales volume.

