.svg)

Sep-2026
Sales
Trend
6-Month
Product Count
SKUs
Avg Price
YoY Sales Change
YoY Price Change


Where to Buy
Nanticoke is stocked at 255 licensed dispensaries across New York, with the deepest coverage in New York, Brooklyn, Queens, Buffalo, and Rochester. Search by ZIP code or city below to find the closest one, or filter by product type if you are after a specific format.
Market Insights Snapshot
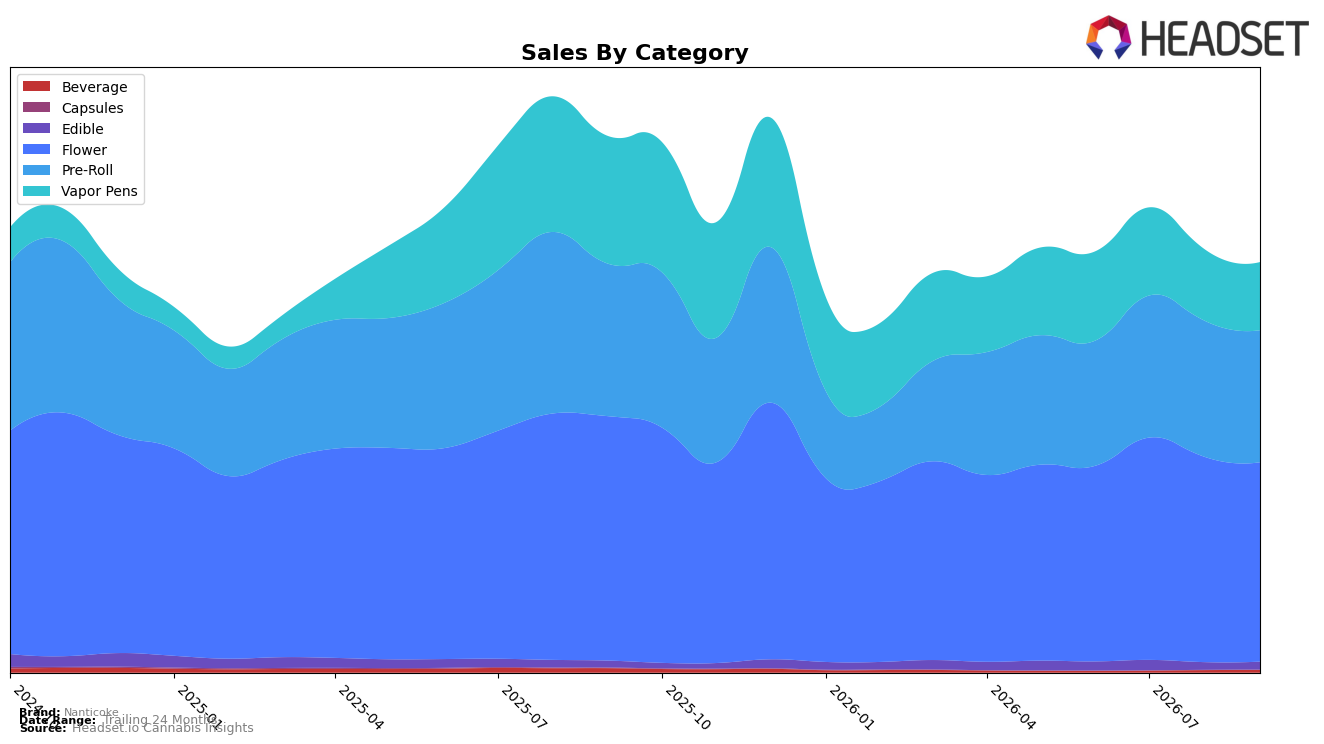
Nanticoke’s category mix in September 2026 skews toward Flower at 48.66% share with a year-over-year decline of 18.45% and a month-over-month dip of 2.88%, while Pre-Roll holds 32.21% share with a 13.40% YoY drop and a 2.99% MoM decline; together these two account for 80.87% of sales concentration and mirror the brand-level sales decline of 23.54% YoY and 4.99% over 24 months. Vapor Pens at 16.60% share contracted 46.70% YoY and 4.70% MoM, contrasting with small but growing Edible at 1.90% share with 15.51% YoY and 4.08% MoM gains and Beverage at 0.63% share with an 8.02% MoM rise despite a 40.54% YoY fall; in New York Flower the brand sits at rank 14. The pattern implies Nanticoke’s heavy reliance on declining inhalables is pulling overall performance downward, while incremental growth in Edible and Beverage is too small at sub-2.53% combined share to offset the double-digit contractions in the core, leaving rank 14 in New York Flower vulnerable if mix does not rebalance.
With average price down 9.80% YoY to $25.01 against category-level volume pressures in Flower (−18.45% YoY) and Vapor Pens (−46.70% YoY), the brand’s pricing moves are not converting to share gains, as evidenced by MoM declines of 2.88% in Flower and 4.70% in Vapor Pens alongside a 2.99% MoM dip in Pre-Roll. The simultaneous YoY growth in Edible at 15.51% and MoM growth in Beverage at 8.02% signal where elasticity and trial are working, but their 1.90% and 0.63% shares, respectively, limit impact; this implies Nanticoke’s positioning is anchored to value-sensitive inhalables where discounting is chasing demand rather than shaping it, and that reallocating assortment toward faster-expanding non-inhalables could stabilize share without relying on further price compression.
Competitive Landscape
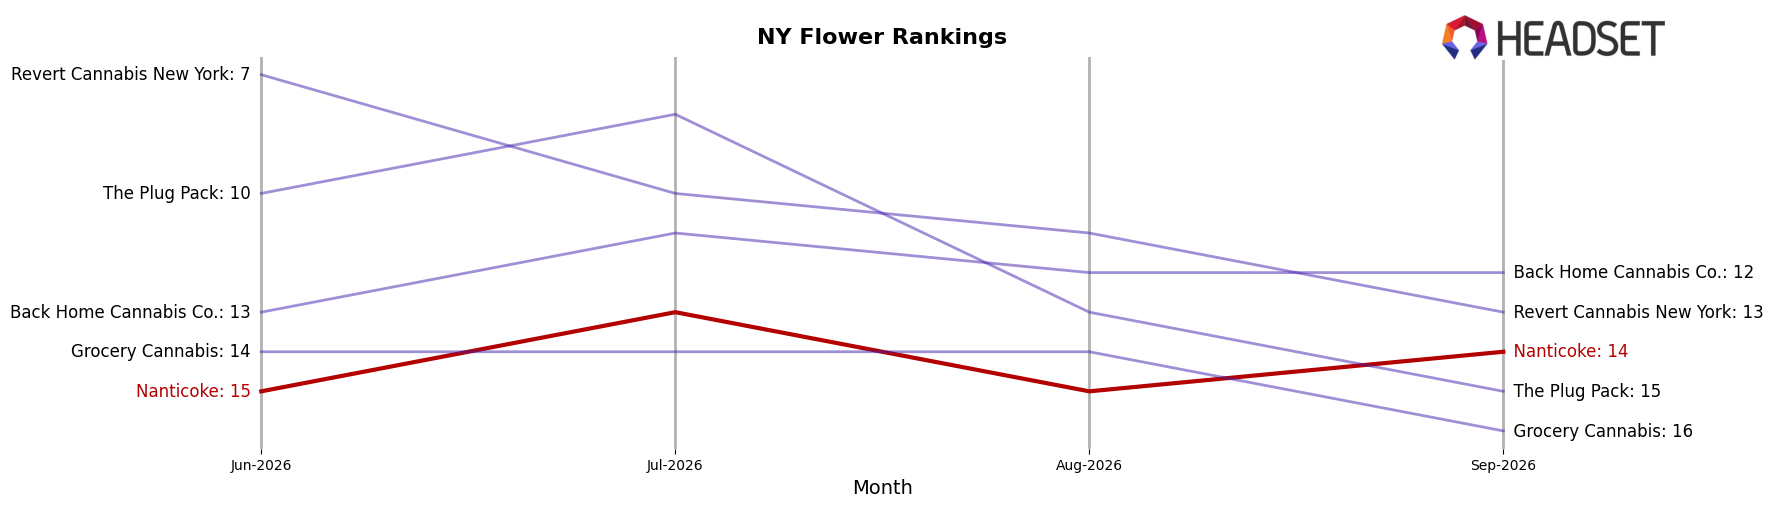
Nanticoke sits at rank #14 in New York Flower in September 2026, down 4 positions year over year from #10, and up 1 spot versus June 2026 when it was #15; the brand’s historical peak was #5 in September 2024, marking a 9-rank slide from peak to current. In contrast, Find. moved from #5 to #1 year over year while growing sales 16.2%, and Grassroots jumped from #15 to #2 with a 150.3% sales increase, indicating competitors are converting momentum into rank gains as Nanticoke cedes positions. This trajectory implies Nanticoke’s competitive position is drifting from prior peak status toward the middle tier unless rank recovery reverses the 4-position YoY decline.
Notable Products
Nanticoke’s steepest decline came from Sour Diesel (3.5g), down 6.6% month over month while sliding to rank 9, as Sour Diesel Pre-Roll (0.5g) also dipped 5.8% at rank 1; together these shifts indicate demand softening for the Diesel family even as it holds key shelf positions. In contrast, Block Monster Pre-Roll (0.5g) climbed 36.7% to rank 5 and Lemon Cherry Gelato Pre-Roll (0.5g) rose 24.3% to rank 2, while Durban Poison Pre-Roll (0.5g) inched up 1.2% at rank 4; the acceleration among these SKUs suggests momentum consolidating within select flavor-forward pre-rolls. With eight of the top ten in the Pre-Roll category and only one Flower SKU in the top ten registering a decline despite $78,124 in September 2026 sales, the mix implies a pivot toward pre-roll-led velocity where flavor novelty is offsetting weakness in legacy Diesel formats.
Top Selling Cannabis Brands






Data for this report comes from real-time sales reporting by participating cannabis retailers via their point-of-sale systems, which are linked up with Headset’s business intelligence software. Headset’s data is very reliable, as it comes digitally direct from our partner retailers. However, the potential does exist for misreporting in the instance of duplicates, incorrectly classified products, inaccurate entry of products into point-of-sale systems, or even simple human error at the point of purchase. Thus, there is a slight margin of error to consider. Brands listed on this page are ranked in the top twenty within the market and product category by total retail sales volume.

