Market Insights Snapshot
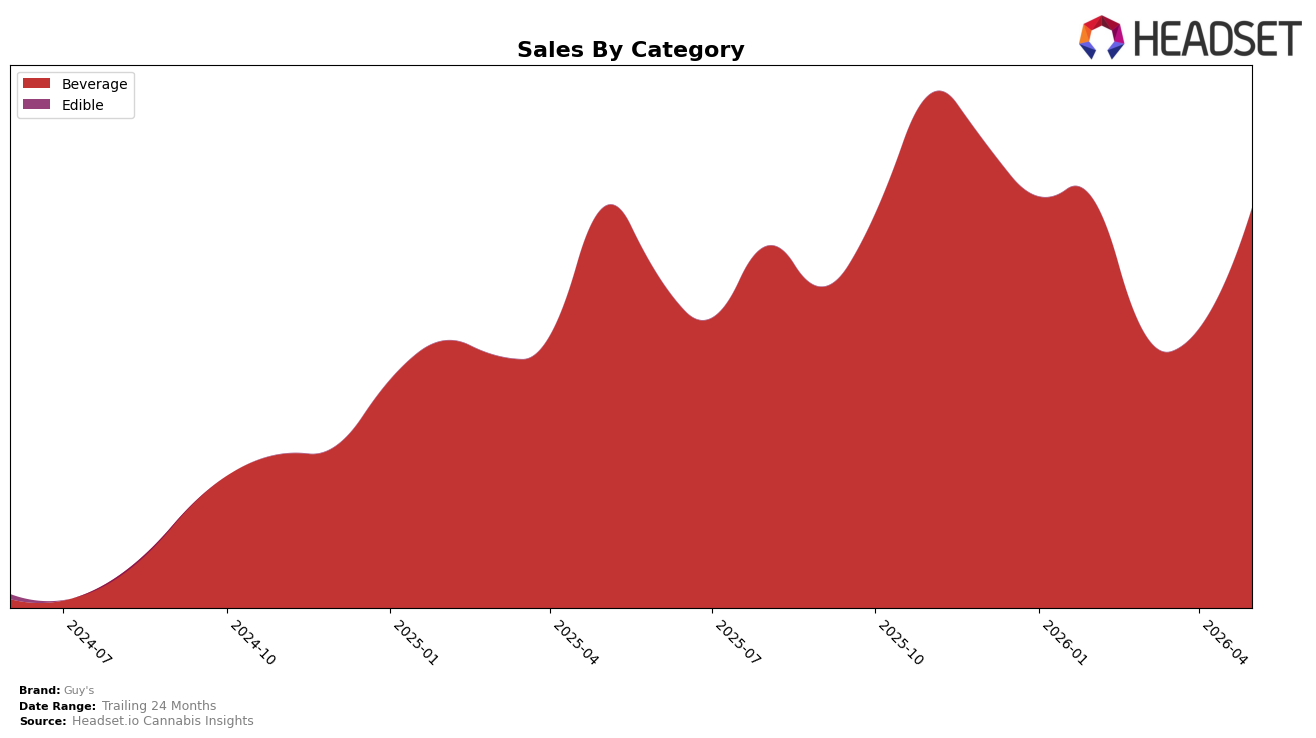
In May 2026, Beverage accounted for 100.0% of Guy's sales mix, with average price at $9.53 alongside a 14.55% YoY price decrease and a 14.24% YoY sales decline, while month-over-month sales rose 43.52%. Within its single-category footprint, this combination of a 100.0% share and a May 2026 rank of 12 in Missouri Beverage signals concentration risk mitigated by short-term volume momentum, implying the brand is leaning on price elasticity to convert a double-digit MoM gain despite a double-digit YoY contraction.
The 14.24% YoY sales decline paired with a 14.55% YoY price reduction indicates volume did not fully offset the lower price, while the 43.52% MoM sales lift at a steady $9.53 average suggests promotional or seasonal pull concentrated in May 2026. Given a 12th-place rank in Missouri Beverage and a 100.0% category mix, the pattern implies Guy's positioning hinges on defending Beverage share through price-led activation rather than mix diversification, with near-term gains relying on sustaining conversion at lower price points and mid-term risk tied to single-category exposure if MoM momentum normalizes.
Competitive Landscape
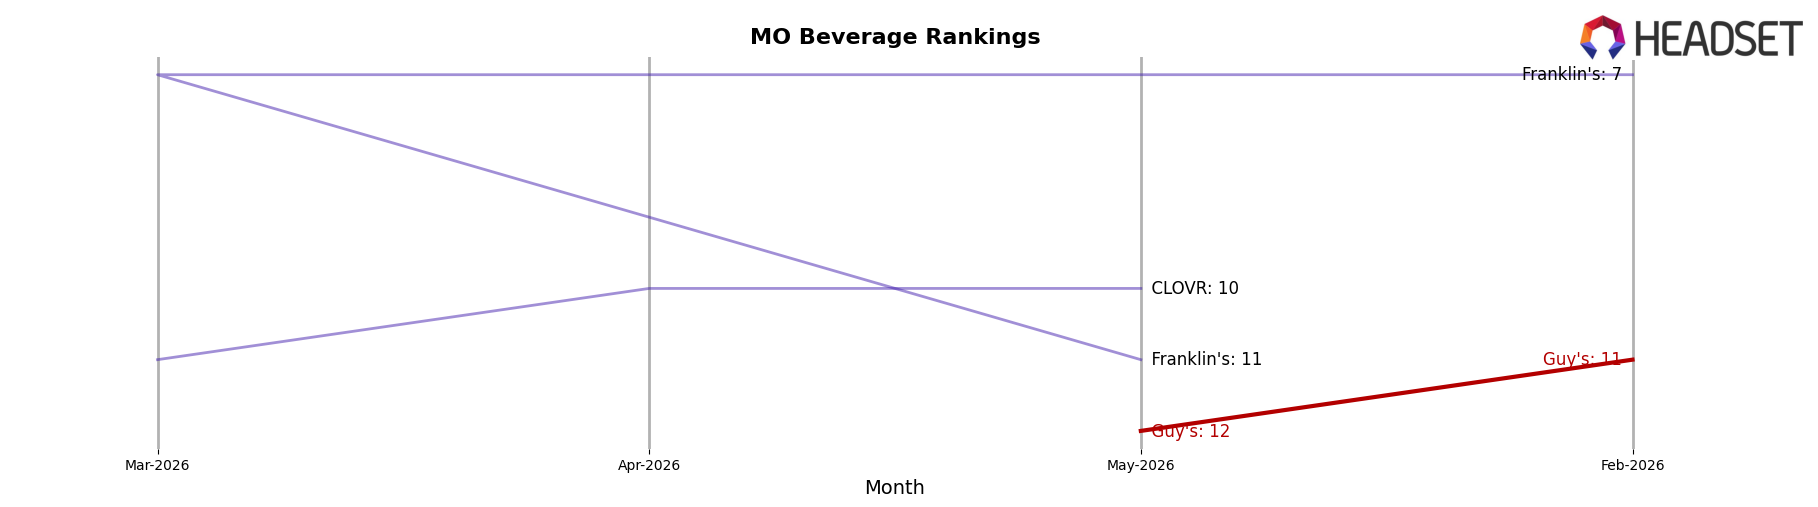
Guy's sits at #12 in MO Beverage in May 2026, down 4 places year over year from #8, and 1 place lower than its February 2026 position of #11, while its peak of #8 in May 2025 marks a 4-rank slide from that high; meanwhile, Keef Cola held #1 year over year and remains #1 now despite a 26.7% YoY sales decline, and Illicit / Illicit Gardens advanced from #4 YoY to #3 with 33.3% YoY sales growth, indicating that Guy's relative slippage amid top-tier stability and upward movers points to share being ceded to competitors improving rank without requiring overall category expansion.
Notable Products
Root Beer Soda (25mg THC, 12oz) posted the largest month-over-month gain at +242.5% and climbed to rank 2, while Grape Soda (25mg THC, 12oz) rose +104.4% to hold rank 1. In contrast, Strawberry Soda (25mg THC, 12oz) fell -51.5% at rank 4, creating a split where two SKUs surged triple- and double-digits as one contracted by half. With five of the top six SKUs in Beverage and two Orange Soda variants spanning ranks 3 and 5 with +47.2% and +119.9% respectively, the lineup is consolidating around citrus and classic soda profiles rather than strawberry. This pattern implies Guy's is tilting assortment and demand toward higher-dosage, nostalgia-flavor beverages that can scale volume quickly, with $3,367 in Grape Soda (25mg THC, 12oz) signaling the anchor while volatility in Strawberry calls for SKU role clarity.
Top Selling Cannabis Brands
Data for this report comes from real-time sales reporting by participating cannabis retailers via their point-of-sale systems, which are linked up with Headset’s business intelligence software. Headset’s data is very reliable, as it comes digitally direct from our partner retailers. However, the potential does exist for misreporting in the instance of duplicates, incorrectly classified products, inaccurate entry of products into point-of-sale systems, or even simple human error at the point of purchase. Thus, there is a slight margin of error to consider. Brands listed on this page are ranked in the top twenty within the market and product category by total retail sales volume.

