Market Insights Snapshot
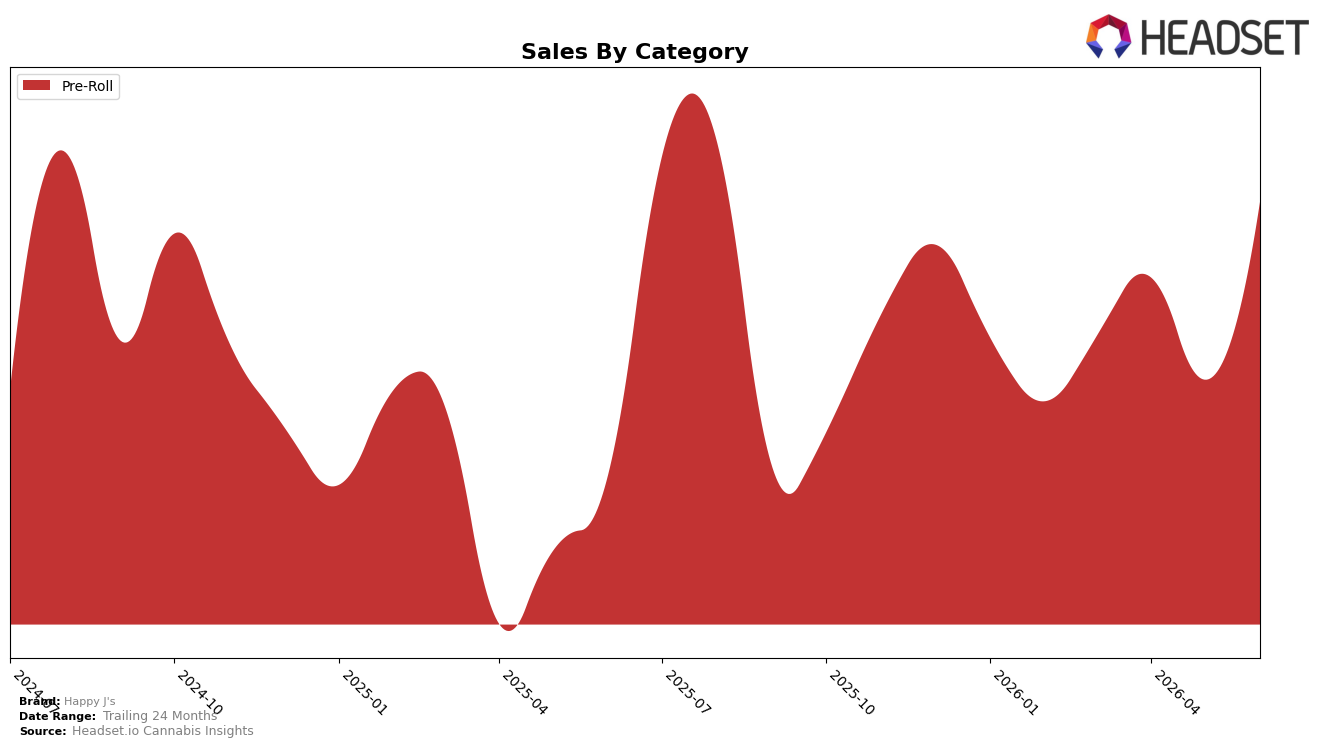
In June 2026, Happy J's operated as a single-category brand with Pre-Roll accounting for 100.0% of sales, pairing a 72.18% year-over-year lift with a 37.65% month-over-month jump. The brand cut average price by 10.85% to $16.06 while expanding share within its own mix to 100.0%, and it held rank 17 in Pre-Roll in Maryland. The pattern implies volume-led growth concentrated in one format, where price elasticity is working in the brand’s favor without diversification beyond Pre-Roll.
The combination of a 37.65% month-over-month surge alongside a 72.18% year-over-year gain, achieved while prices fell 10.85% and rank sat at 17 in Maryland, suggests a positioning anchored in accessible pricing to accelerate unit throughput. With 100.0% of revenue in Pre-Roll and average price at $16.06, the brand is trading margin per unit for reach and velocity, which implies near-term priority on shelf penetration and basket frequency rather than premium tier expansion.
Competitive Landscape
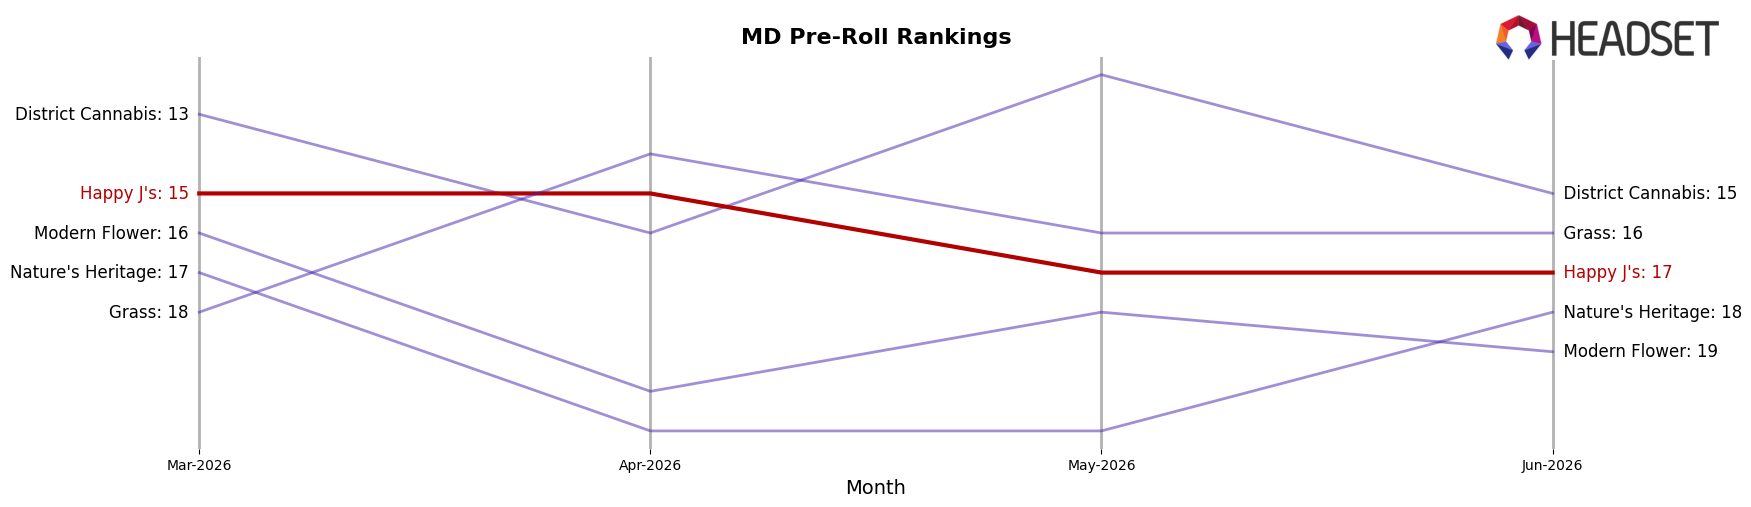
Happy J's sits at rank #17 in MD Pre-Roll for June 2026, sliding 1 position year over year from #16 while falling 2 spots from March 2026’s #15; this comes after a peak at #11 in August 2024, indicating a multi-quarter erosion from its prior ceiling. Competitive movement is tightening at the top: SunMed climbed from #4 to #1 alongside a 76.59% year-over-year sales increase, while RYTHM rose from #3 to #2 on 39.45% growth, contrasting with Dogwalkers slipping from #1 to #3 with a 14.09% decline and Curio Wellness dropping from #2 to #5 on a 48.19% decrease; the directional mix signals that momentum is consolidating among climbers rather than legacy leaders. The rank trajectory implies Happy J's is being outpaced by faster risers and now requires a share-defense play, as continued minor rank losses against double-digit competitor gains risk cementing a mid-pack position.
Notable Products
Deadband 12 Pre-Roll 2-Pack (1g) posted the largest month-over-month movement in June 2026 with +124.96% and climbed to rank 2, while Rainbow Push Pop 4 Pre-Roll 2-Pack (1g) advanced +104.53% to rank 1. In contrast, Ice Cream Cake Pre-Roll 2-Pack (1g) fell -27.25% to rank 3 and Gumi #6 Pre-Roll 2-Pack (1g) declined -44.12% to rank 4, indicating a sharp bifurcation between a couple of surging leaders and mid-tier pullbacks. Seven of the top ten are Pre-Roll 2-Packs, and three Rainbow Push Pop variants sit within ranks 1, 6, and 7, concentrating momentum in a tight family while a new 7-Pack format at rank 5 suggests trading up around $37,412 in sales. The pattern implies Happy J's is consolidating share around a few breakout SKUs in Pre-Roll 2-Packs while expanding pack-size tiers to capture higher-value baskets.
Top Selling Cannabis Brands
Data for this report comes from real-time sales reporting by participating cannabis retailers via their point-of-sale systems, which are linked up with Headset’s business intelligence software. Headset’s data is very reliable, as it comes digitally direct from our partner retailers. However, the potential does exist for misreporting in the instance of duplicates, incorrectly classified products, inaccurate entry of products into point-of-sale systems, or even simple human error at the point of purchase. Thus, there is a slight margin of error to consider. Brands listed on this page are ranked in the top twenty within the market and product category by total retail sales volume.

