Jun-2026
Sales
Trend
6-Month
Product Count
SKUs
Avg Price
YoY Sales Change
YoY Price Change
Market Insights Snapshot
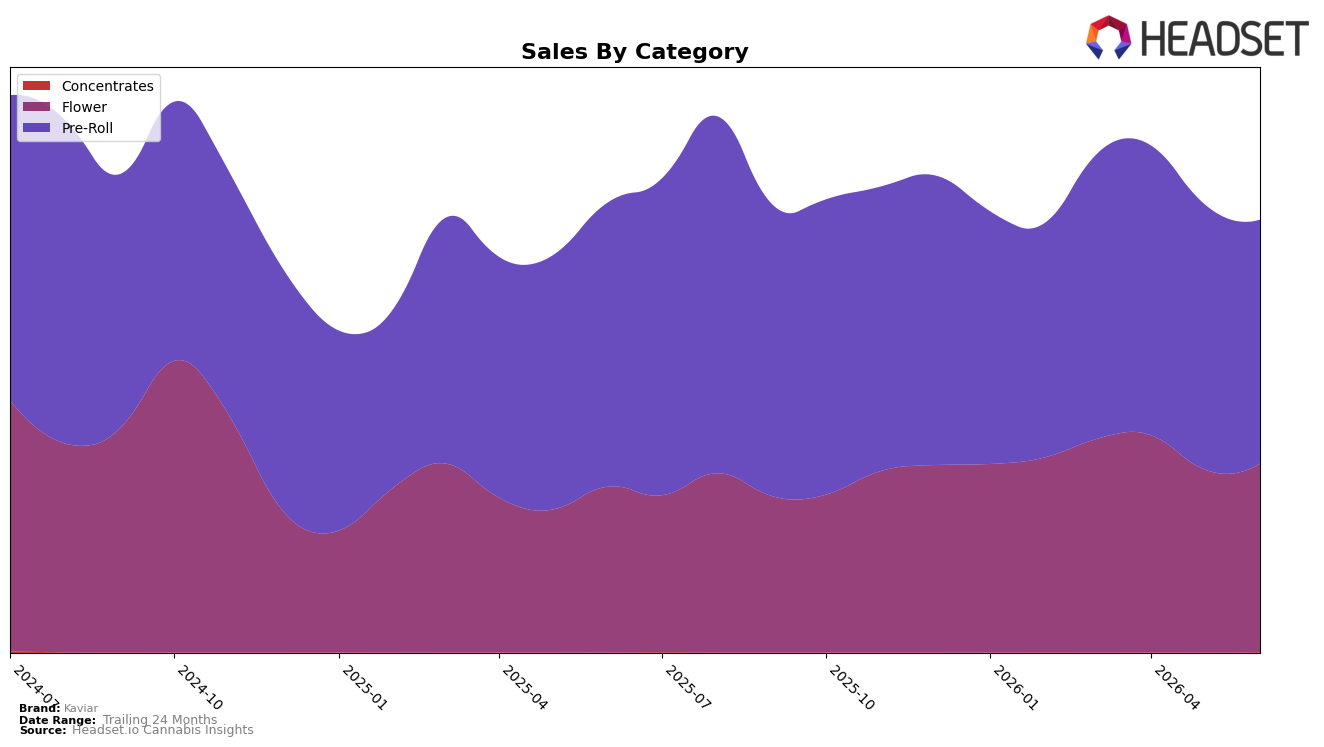
In June 2026, Kaviar’s mix concentrated in Pre-Roll at 56.36% share with year-over-year sales down 14.27% and month-over-month down 8.05%, while Flower rose to 43.55% share with year-over-year sales up 13.72% and month-over-month up 3.06%. Concentrates remained marginal at 0.09% share but surged month-over-month by 369.96%, off a small base, as average price across the brand fell 5.16% year-over-year to $26.54 while overall brand sales declined 3.89% year-over-year; this combination implies the portfolio is pivoting toward higher-growth Flower to offset Pre-Roll drag without overexposing to nascent subcategories.
The shift toward Flower coincides with a rank of 16 in Flower within Illinois, indicating mid-tier visibility that could improve if the 3.06% month-over-month gain compounds and the 13.72% year-over-year lift sustains. With Pre-Roll contracting 8.05% month-over-month against a 5.16% brand-wide price decrease, mix pressure is likely depressing revenue efficiency; increasing the Flower mix by even 2–3 percentage points while maintaining its current growth rates would counterbalance the 14.27% Pre-Roll decline and support a move up from rank 16, implying that prioritizing Flower depth over incremental Pre-Roll breadth is the cleaner route to near-term share stabilization.
Competitive Landscape
Kaviar ranks #16 in Illinois Flower in June 2026, improving 5 positions YoY from #21 while slipping 1 spot from March 2026’s #17; this sits below its peak of #14 in July 2024 and places it behind High Supply / Supply holding #1 with +32.1% YoY sales and RYTHM steady at #2 with -5.2% YoY sales, as &Shine climbed from #10 to #5 with +28.5% YoY sales while Simply Herb slipped from #3 to #4 with -16.8% YoY sales; the pattern implies Kaviar’s gradual rank recovery is intact YoY but is being outpaced by faster risers, so maintaining gains likely requires capturing share from mid-tier movers rather than the top two.

Notable Products
Kaviar x Happy Eddie - Zen Wen Infused Pre-Roll (1.5g) posted the steepest decline in June 2026 at -20.0% while holding rank 2, and Indica Live Resin Infused Pre-Roll (1.5g) fell -15.6% at rank 1; together these drops contrast with Hybrid Infused Pre-Roll 5-Pack (3g) rising +24.7% at rank 4. Nine of the top ten are Pre-Rolls, and two Minis 5-Packs sit at ranks 5 and 6 with -0.4% and +12.0% MoM respectively, which implies mix is tilting from flagship 1.5g singles toward value-oriented multi-packs.
Sativa Blend Infused Pre-Roll (1.5g) slid -15.1% at rank 9, while Pineapple Donuts (3.5g) in Flower dropped -17.6% at rank 10 on $37,088, concentrating category risk outside Pre-Rolls. With two 1.5g singles at ranks 1 and 2 both down double digits and only one material gainer above +20%, the pattern implies Kaviar’s commercial direction favors pack formats to sustain rank while singles need pricing or strain refresh.
Top Selling Cannabis Brands
Data for this report comes from real-time sales reporting by participating cannabis retailers via their point-of-sale systems, which are linked up with Headset’s business intelligence software. Headset’s data is very reliable, as it comes digitally direct from our partner retailers. However, the potential does exist for misreporting in the instance of duplicates, incorrectly classified products, inaccurate entry of products into point-of-sale systems, or even simple human error at the point of purchase. Thus, there is a slight margin of error to consider. Brands listed on this page are ranked in the top twenty within the market and product category by total retail sales volume.

