.svg)

Sep-2026
Sales
Trend
6-Month
Product Count
SKUs
Avg Price
YoY Sales Change
YoY Price Change


Market Insights Snapshot
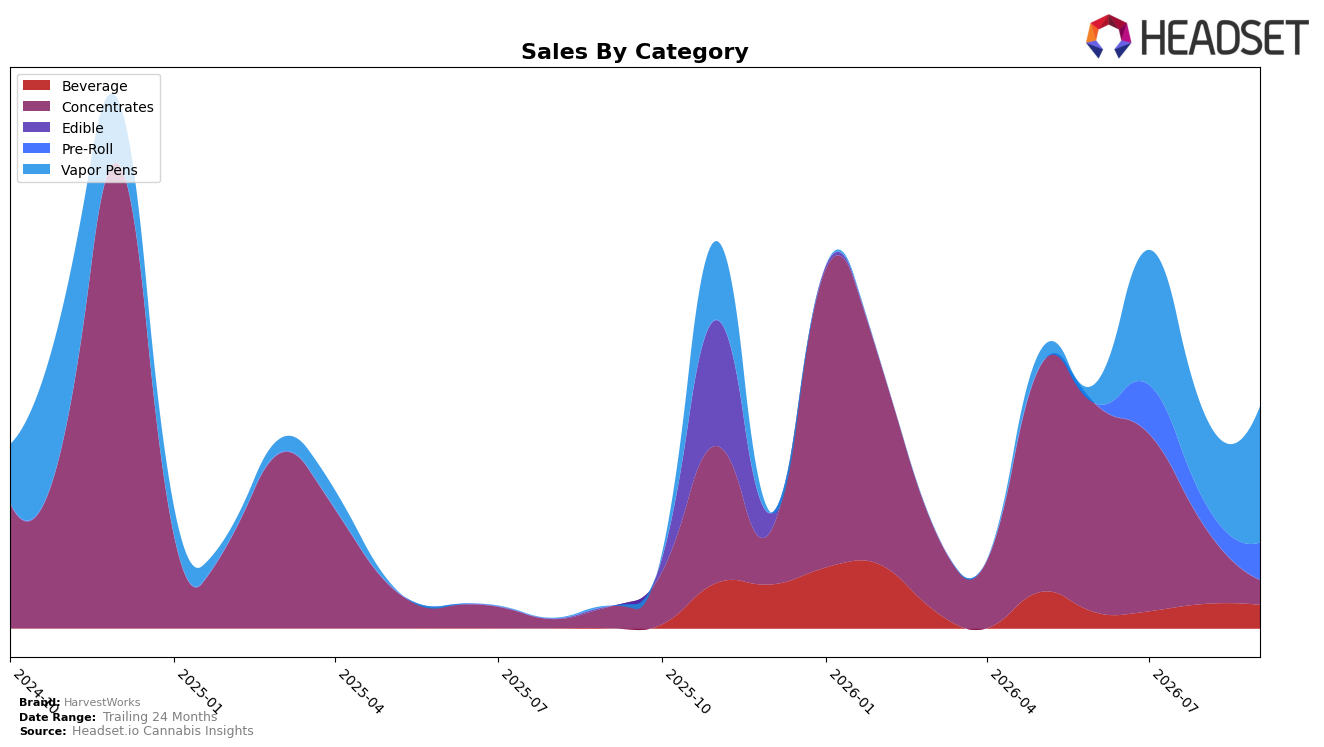
HarvestWorks concentrated its September 2026 mix in Vapor Pens at 61.62% share with a 55.59% month-over-month lift, while Pre-Roll reached 16.69% share on a 51.89% MoM increase. In contrast, Concentrates held 11.06% share despite a 16.81% year-over-year uptick paired with a -68.22% MoM drop, and Beverage accounted for 10.63% share with a -3.93% MoM decline. The brand-level context shows 956.60% year-over-year sales growth alongside a -21.58% YoY average price change, implying volume expansion even as price points compressed, and the category balance suggests short-term momentum shifted heavily into inhalables while legacy strength in Concentrates receded month-on-month.
The mix shift implies HarvestWorks is repositioning toward higher-velocity inhalable formats, as Vapor Pens and Pre-Roll together represent 78.31% of sales with simultaneous MoM gains of 55.59% and 51.89%, respectively, while Concentrates’ -68.22% MoM slide reduced its influence despite a 16.81% YoY rise. With Beverage steadying at 10.63% share on a modest -3.93% MoM move and average price down 21.58% YoY against 956.60% YoY sales growth, the brand appears to be trading price for reach and basket penetration in New Jersey, tilting assortment toward accessible inhalables and away from a historically emphasized Concentrates position.
Competitive Landscape
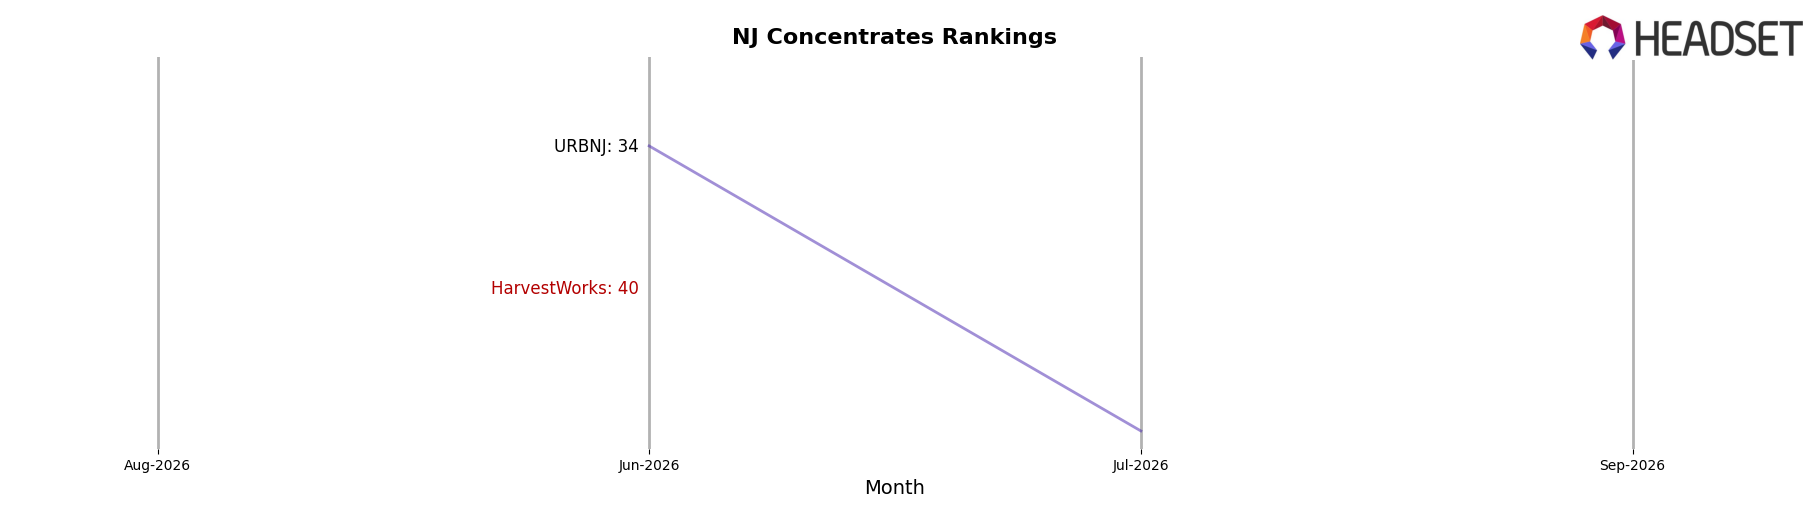
HarvestWorks sits at rank #68 in New Jersey Concentrates in September 2026, slipping 23 positions year over year from #45, and falling 28 spots since June 2026 when it was #40; the gap from the historical peak of #15 in December 2024 underscores a multi-quarter descent. Meanwhile, Grassroots advanced to #1 from #2 with +21.7% year-over-year sales, and Pyramid Pens moved up to #5 from #10 with +46.7% sales growth, whereas RYTHM slipped from #1 to #2 alongside a -33.2% sales decline; this mix indicates competitors are either consolidating at the top or rapidly ascending while HarvestWorks’ downward rank trajectory implies erosion of share and shelf presence unless a reversal occurs.
Notable Products
Cherry Cartel + Grapes & Cream Hash Hole Infused Pre-Roll (1.8g) led September 2026 with a 225.5% month-over-month surge and a jump to rank 1, while Grapes n Cream Cold Cure Live Rosin (1g) fell 77.0% to rank 10, marking the steepest decline among the top ten. Modified Banana Pebbles Live Rosin Disposable (1g) rose 212.5% to rank 4, contrasting with Desert Pear Sips Syrup (100mg THC, 2oz, 355ml) dropping 72.1% at rank 9, and four of the top ten are Vapor Pens clustered between ranks 3–7. The beverage set split sharply with Mango Solventless Rosin Syrup (100mg THC, 2oz, 60ml) entering at rank 2 despite no MoM baseline, while Cherry Lime Sips Syrup (100mg THC, 2oz, 355ml) declined 43.6% at rank 5, indicating polarization rather than category-wide momentum. This mix implies HarvestWorks is tilting toward inhalable formats and a hero pre-roll strategy, using high-velocity Vapor Pens to buffer volatility in Concentrates and selectively pruning underperforming Beverage SKUs even as one premium syrup drives episodic spikes.
Top Selling Cannabis Brands






Data for this report comes from real-time sales reporting by participating cannabis retailers via their point-of-sale systems, which are linked up with Headset’s business intelligence software. Headset’s data is very reliable, as it comes digitally direct from our partner retailers. However, the potential does exist for misreporting in the instance of duplicates, incorrectly classified products, inaccurate entry of products into point-of-sale systems, or even simple human error at the point of purchase. Thus, there is a slight margin of error to consider. Brands listed on this page are ranked in the top twenty within the market and product category by total retail sales volume.

