Jun-2026
Sales
Trend
6-Month
Product Count
SKUs
Avg Price
YoY Sales Change
YoY Price Change
Market Insights Snapshot
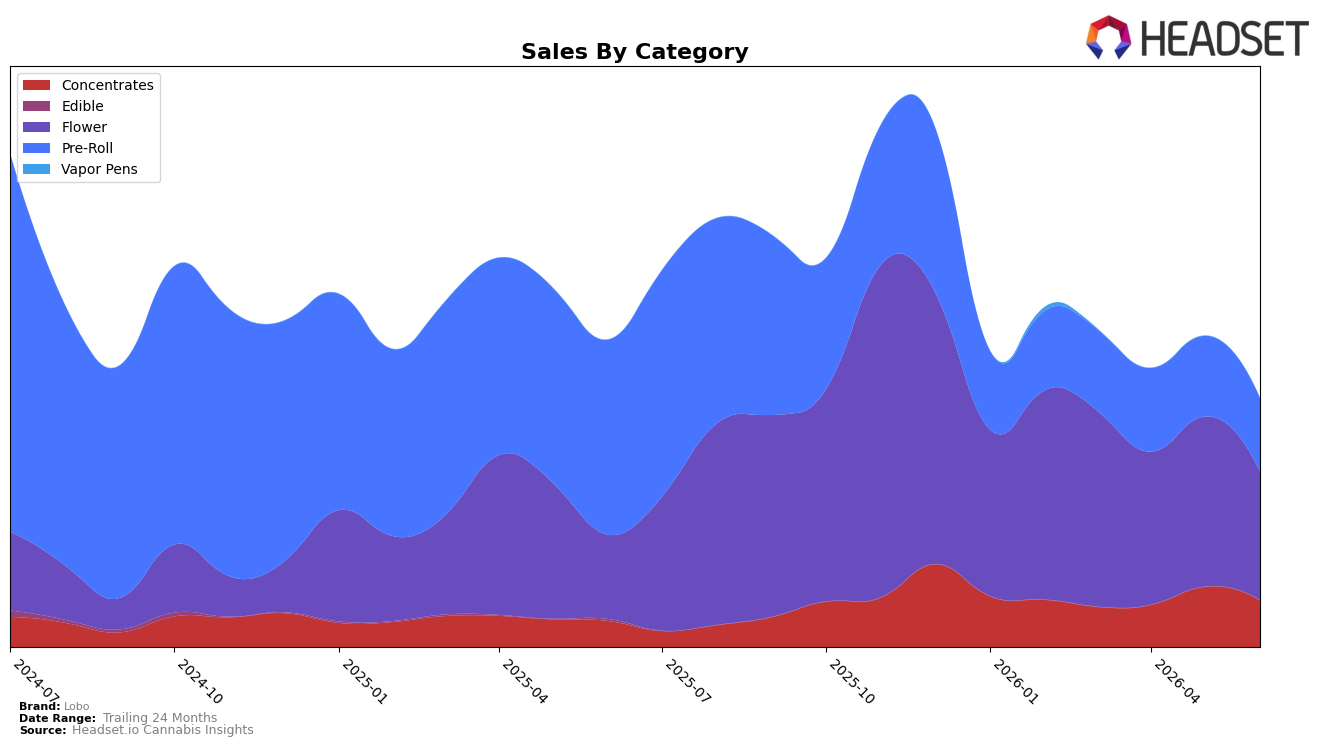
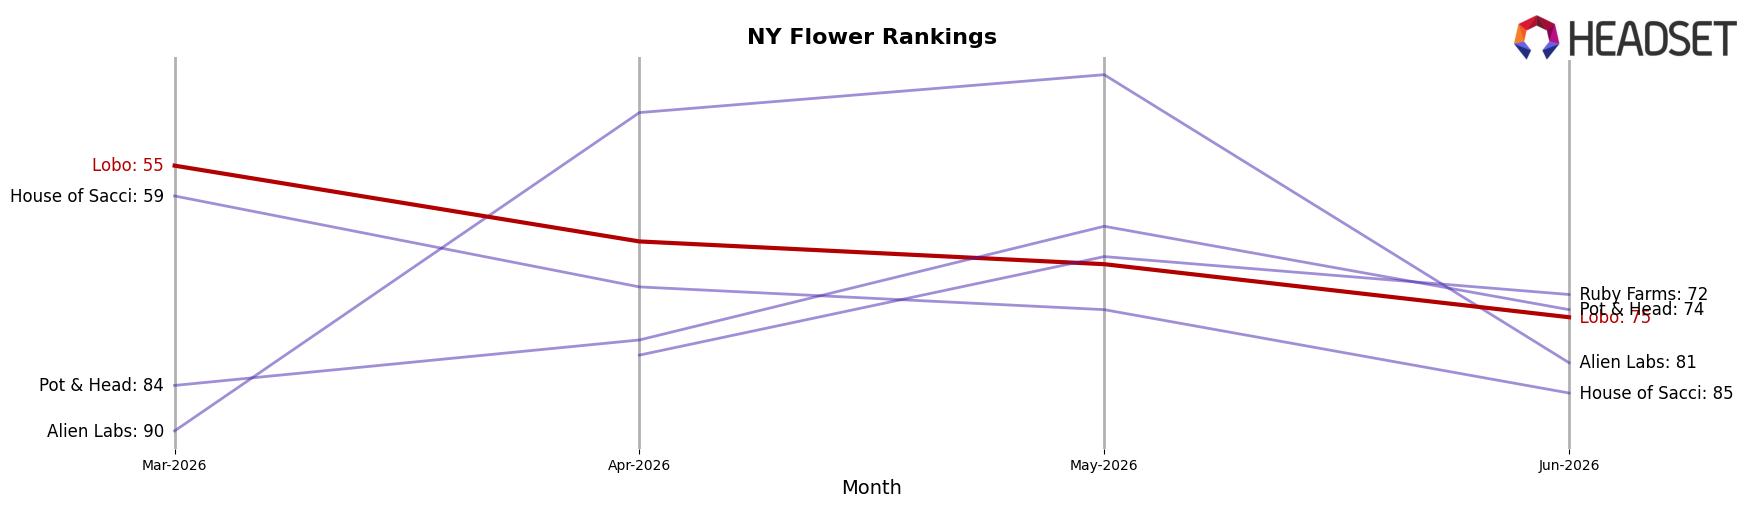
In June 2026, Lobo’s category mix pivoted toward Flower at 51.67% share with year-over-year growth of 52.54% but a month-over-month decline of 24.54%, while Concentrates reached 18.68% share with 79.85% YoY growth and a 22.50% MoM pullback; Pre-Roll contracted to 29.65% share with a 62.28% YoY drop and an 8.64% MoM decline. Despite an average price up 2.14% and overall brand sales down 19.04% YoY, the surge in Flower and Concentrates suggests mix-driven resilience against a 52.66% 24-month slide, concentrated in New York where Flower ranks 75th, implying a volume gap versus the market’s upper tiers.
The shift toward higher-growth Flower and Concentrates — together 70.35% of sales with YoY gains of 52.54% and 79.85% but MoM declines of 24.54% and 22.50% — implies Lobo is leaning into potency-forward baskets while Pre-Roll’s 62.28% YoY contraction and 8.64% MoM erosion cap trial and repeat. With the average Flower price at $49.47 against a brand average of $34.81 and Concentrates at $35.22, the mix tilts to higher-ticket items even as June 2026 MoM softness signals inventory or promotional gaps; this setup positions Lobo to target fewer, higher-value purchases to climb from rank 75 in New York Flower if it can convert category momentum into steadier monthly volume.
Competitive Landscape
Lobo is ranked #75 in New York Flower for June 2026, improving 13 positions year over year from #88 but sliding 20 spots since March 2026 when it was #55; relative to its peak of #46 in November 2025, the current placement is 29 ranks lower, indicating lost mid-year momentum even as annual standing improved. In contrast, Find. rose from #3 to #1 while growing sales by 35.6%, and Leal advanced from #7 to #2 with 44.4% sales growth, whereas Dank. By Definition slipped from #1 to #3 alongside a 50.7% sales decline; this divergence suggests Lobo’s YoY rank lift is insufficient against leaders expanding share and leapfrogging ranks, implying that without near-term recovery toward the #46 peak, Lobo’s trajectory points to continued competitive displacement in the category.
Notable Products
Sour Diesel Hashish (1g) posted the steepest decline in June 2026 at -47.6% MoM while sliding to rank 5, and Gelonade Moonrocks (3.5g) at rank 1 fell -19.3% MoM despite maintaining the top slot. Sativa Blend Infused Pre-Ground (7g) delivered a +50.4% MoM surge at rank 2, narrowing the gap to the leader on a materially different trajectory than the -21.8% and -26.4% drops seen by Blue Dream Minis Pre-Roll 5-Pack (2.5g) at rank 10 and Bold - Blue Dream Infused Pre-Roll (1g) at rank 8. Four of the top ten are Pre-Roll SKUs, but their negative MoM skew contrasts with Flower’s mixed picture where one SKU added over $22,000 in June 2026, implying Lobo’s near-term volume is migrating toward value-forward Flower while premium inhalables face pressure.
Top Selling Cannabis Brands
Data for this report comes from real-time sales reporting by participating cannabis retailers via their point-of-sale systems, which are linked up with Headset’s business intelligence software. Headset’s data is very reliable, as it comes digitally direct from our partner retailers. However, the potential does exist for misreporting in the instance of duplicates, incorrectly classified products, inaccurate entry of products into point-of-sale systems, or even simple human error at the point of purchase. Thus, there is a slight margin of error to consider. Brands listed on this page are ranked in the top twenty within the market and product category by total retail sales volume.

