Jun-2026
Sales
Trend
6-Month
Product Count
SKUs
Avg Price
YoY Sales Change
YoY Price Change
Market Insights Snapshot
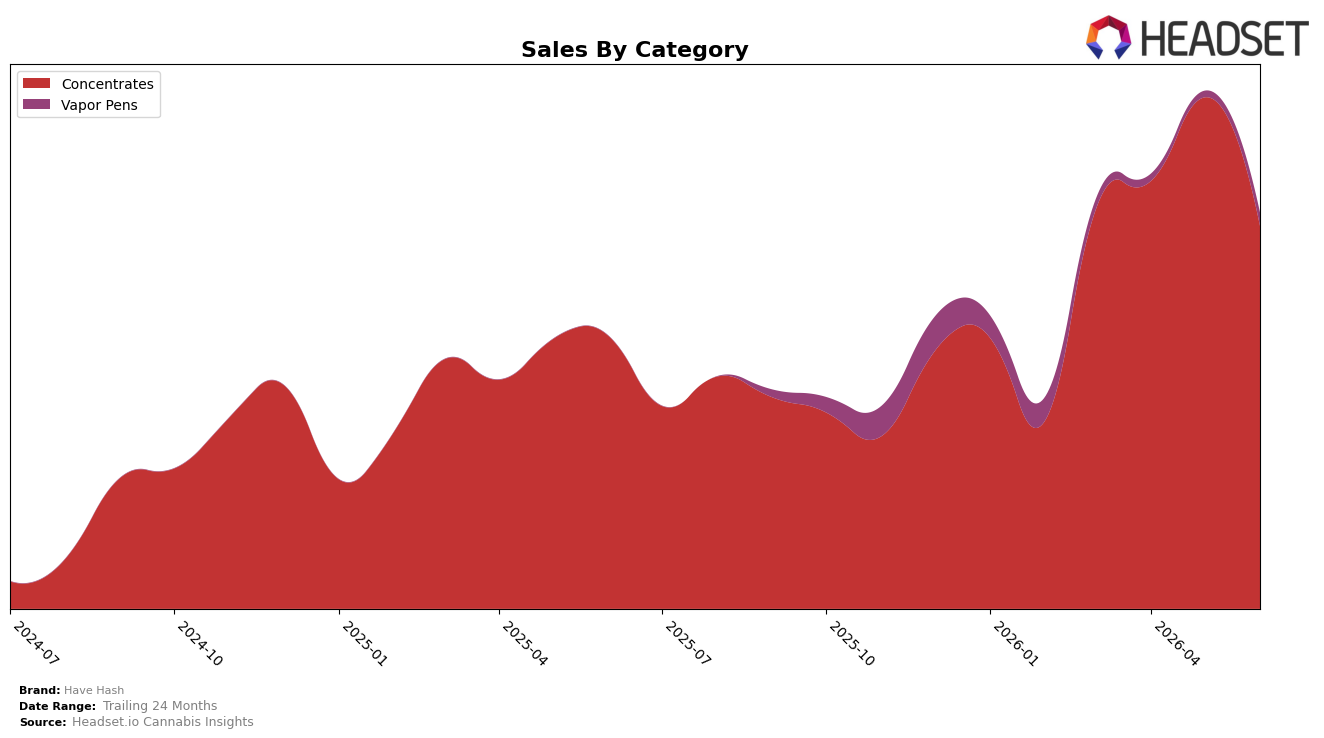
Have Hash concentrated 96.71% of June 2026 sales in Concentrates while Vapor Pens accounted for 3.29%, indicating an even tighter focus than typical mixed portfolios. Within Concentrates, year-over-year sales rose 40.25% but month-over-month declined 25.16%, whereas Vapor Pens registered a 108.90% month-over-month lift off a small base with no year-over-year comp. Average price rose 13.82% year over year to $57.52, with Concentrates pricing at $57.88 and Vapor Pens at $48.64. The brand ranked 12 in Concentrates in California, pairing mid-tier placement with a heavy category tilt. The mix implies deliberate pricing power in the core alongside volatility in month-to-month sell-through, and the nascent Vapor Pens contribution suggests a test-and-expand stance rather than diversification-led volume defense.
The combination of a 25.16% month-over-month dip in the 96.71%-weight Concentrates and a 108.90% month-over-month surge in a 3.29%-weight Vapor Pens points to risk concentration: small wins in Vapor Pens cannot offset swings in the core. With Concentrates up 40.25% year over year and the brand holding rank 12 in California, the portfolio is positioned as a category specialist where rank gains would likely require either mix broadening or deeper penetration within existing accounts. The 13.82% year-over-year average price increase, alongside category-level growth, implies pricing is carrying part of the annual comp, but June 2026’s month-over-month pullback indicates elasticity or timing effects that the current mix amplifies; strategically, mitigating intra-quarter volatility will likely require raising the Vapor Pens share several points or smoothing Concentrates drops through targeted launches.
Competitive Landscape
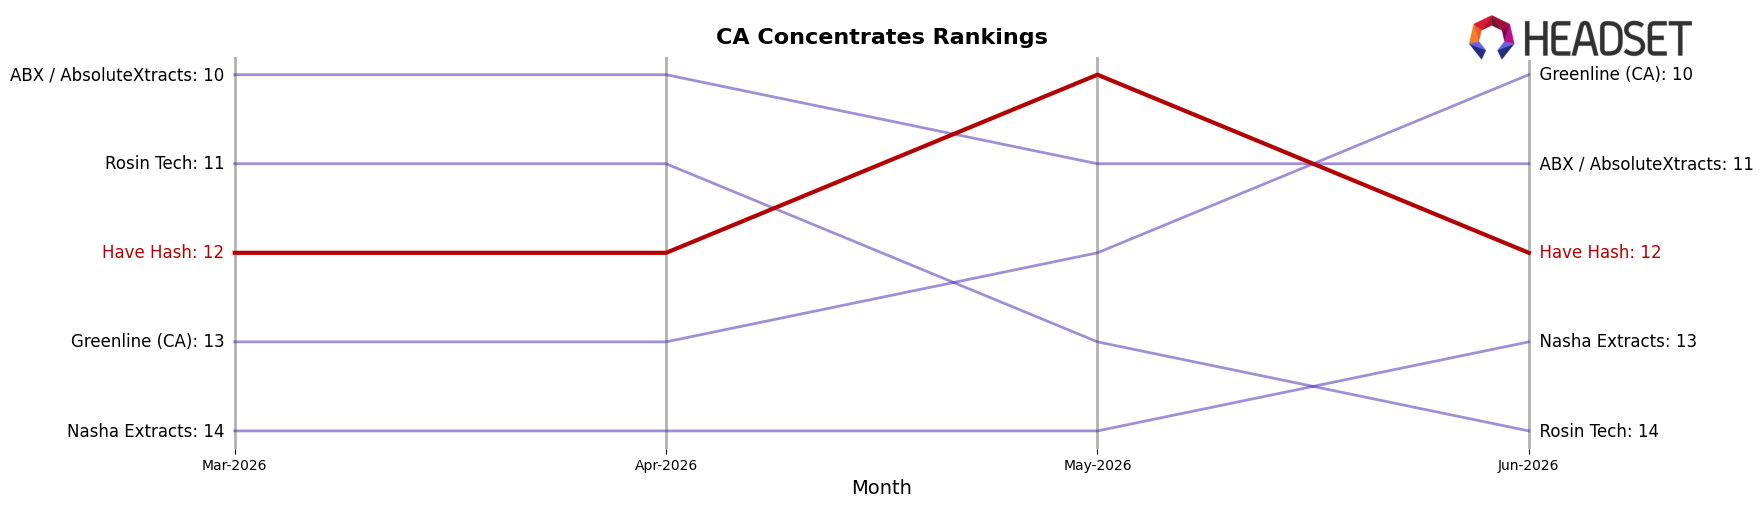
Have Hash sits at rank #12 in CA Concentrates in June 2026, improving 2 positions from #14 year over year and holding flat versus March 2026 at #12; the brand also briefly peaked at #10 in May 2026, marking a 2-position rise month over month before slipping back 2 positions. Against top-tier peers, Raw Garden maintained #1 with a 0-position change year over year while posting a 7.0% sales lift, and 710 Labs climbed from #4 to #3 alongside a 24.7% sales increase, whereas Punch Extracts / Punch Edibles fell from #3 to #4 with a 29.1% sales decline; by contrast, Have Hash’s brief ascent to #10 in May 2026 followed by a return to #12 in June 2026 indicates positioning that is improving year over year but vulnerable to short-term share shifts at the top of the leaderboard, implying the brand is stabilizing mid-tier rather than breaking into the top 10 sustainably.
Notable Products
Black Cherry Lime Cold Cured Live Rosin (1g) posted the steepest movement in June 2026 with a -62.0% month-over-month drop while falling to rank 5, contrasting with Peach Ringz Cold Cure Live Rosin (1g) inching up 2.8% at rank 1; the divergence implies volatility at the tail even as the flagship holds its position. Blue Banana Cold Cure Live Rosin (1g) advanced 39.1% month over month and sits at rank 3, while Private Reserve - Peach Zours Cold Cure Live Rosin (1g) declined 8.4% at a tied rank 3, indicating mixed momentum within the same rank band and a shuffle in share-of-voice among 1g formats. Eight of the top ten are Concentrates SKUs with two 2g entries in the top ten, and only one raw-dollar anchor near $17,941 suggests volume concentration in a few headline grams rather than broad-based upsell to 2g. Taken together, the pattern points to a portfolio leaning on a stable hero 1g SKU with opportunistic but fragile depth, signaling a need to hedge against sharp single-SKU retreats while testing scalable 2g placements.
Top Selling Cannabis Brands
Data for this report comes from real-time sales reporting by participating cannabis retailers via their point-of-sale systems, which are linked up with Headset’s business intelligence software. Headset’s data is very reliable, as it comes digitally direct from our partner retailers. However, the potential does exist for misreporting in the instance of duplicates, incorrectly classified products, inaccurate entry of products into point-of-sale systems, or even simple human error at the point of purchase. Thus, there is a slight margin of error to consider. Brands listed on this page are ranked in the top twenty within the market and product category by total retail sales volume.

