.svg)

Aug-2026
Sales
Trend
6-Month
Product Count
SKUs
Avg Price
YoY Sales Change
YoY Price Change


Where to Buy
Headliners is stocked at 51 licensed dispensaries across Massachusetts, with the deepest coverage in Boston, Springfield, Brockton, Fall River, and Framingham. Search by ZIP code or city below to find the closest one, or filter by product type if you are after a specific format.
Market Insights Snapshot
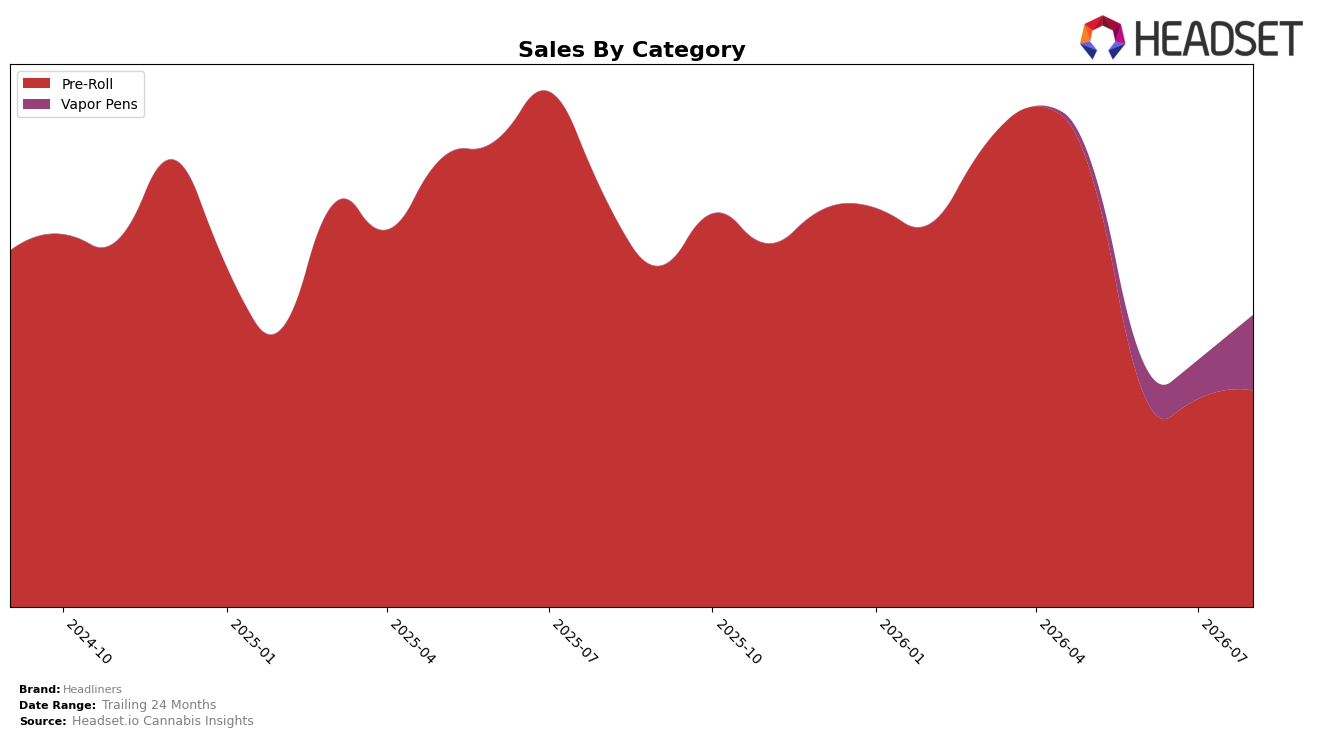
Headliners concentrated 74.17% of August 2026 sales in Pre-Roll while Vapor Pens accounted for 25.83%, indicating a heavier tilt to Pre-Roll than typical mixed portfolios. Pre-Roll sales fell 47.45% year over year but rose 4.09% month over month, whereas Vapor Pens posted a 94.83% month-over-month surge without a reported year-over-year baseline; this split coincided with a 2.81% year-over-year increase in average price and an overall brand sales decline of 29.15% year over year. With Pre-Roll ranked 42 in Massachusetts and holding the largest share of mix, the pattern implies the brand is overexposed to a shrinking Pre-Roll base while relying on a rapidly expanding but still smaller Vapor Pens stream to stabilize near-term momentum.
The mix shift — modest Pre-Roll recovery at +4.09% month over month alongside a 94.83% month-over-month jump in Vapor Pens — suggests Headliners’ positioning is migrating from a single-category anchor toward a two-pillar portfolio, but the 47.45% Pre-Roll year-over-year drop keeps the center of gravity risky. With average price up 2.81% year over year against a 29.15% brand sales contraction, elasticity risk is concentrated in Pre-Roll, implying the brand can lean into the higher ticket Vapor Pens (average price $41.97) to offset volume pressure while improving Pre-Roll rank from 42 by tightening price-pack architectures around the $7.66 average price point.
Competitive Landscape
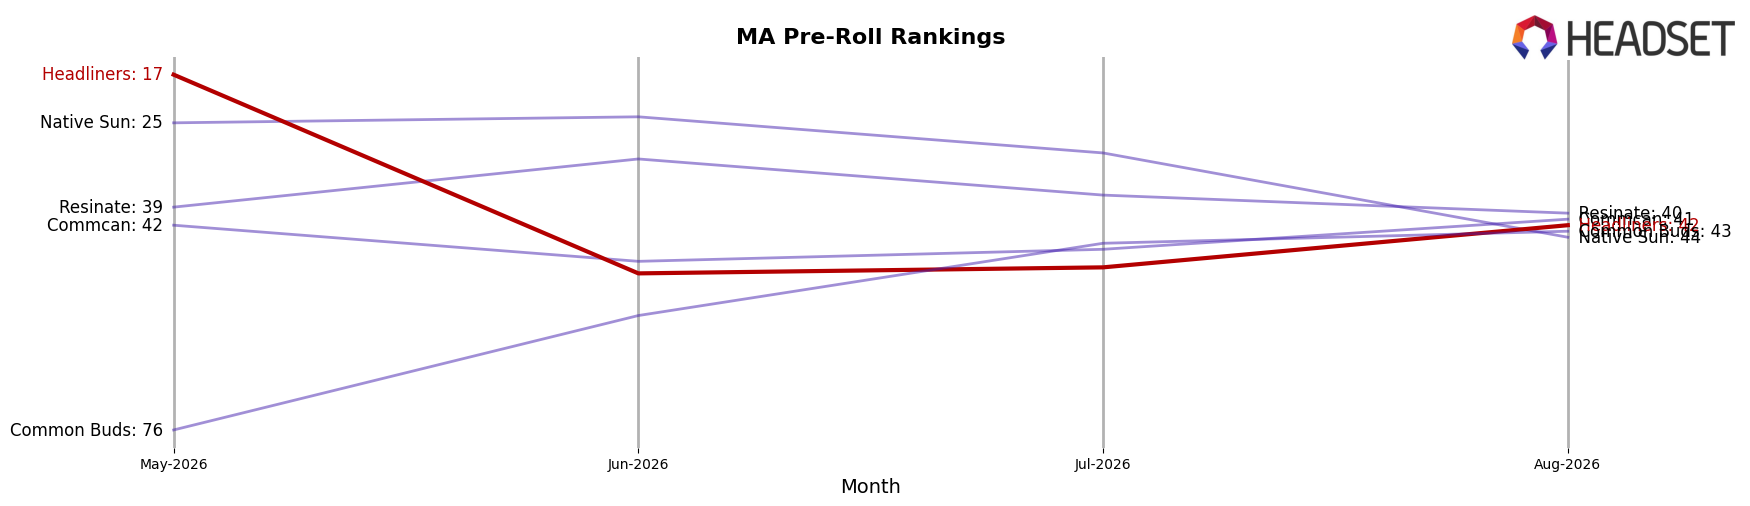
Headliners sits at rank #42 in MA Pre-Roll in August 2026, down 22 spots from #20 year over year, after sliding from #17 three months ago and off its peak of #14 in April 2026; by contrast, Jeeter held rank #1 with a flat year-over-year position at #1, while Cali-Blaze advanced from #6 to #2 alongside a 146.3% year-over-year sales lift, indicating Headliners is losing rank share as faster-climbing rivals consolidate the top tier.
Notable Products
Rainbow Guava Pre-Roll (1g) delivered the standout movement in August 2026 with a +72.5% MoM surge to $15,216 and secured rank 1, while Champagne Cookies Pre-Roll (1g) fell -52.8% to rank 7 and Swamp Water Fumez Pre-Roll (1g) slid -27.1% to rank 10. Animal Mints Pre-Roll (1g) also advanced with +55.9% MoM at rank 3, and Alaskan Unicorn Pre-Roll (1g) rose +35.2% at rank 2, concentrating gains at the very top of the ranking. With all ten top SKUs in Pre-Roll, the category concentration alongside a mix of +72.5% and -52.8% swings implies Headliners is leaning into a hit-driven Pre-Roll portfolio that rewards rapid iteration but carries higher volatility risk.
Top Selling Cannabis Brands






Data for this report comes from real-time sales reporting by participating cannabis retailers via their point-of-sale systems, which are linked up with Headset’s business intelligence software. Headset’s data is very reliable, as it comes digitally direct from our partner retailers. However, the potential does exist for misreporting in the instance of duplicates, incorrectly classified products, inaccurate entry of products into point-of-sale systems, or even simple human error at the point of purchase. Thus, there is a slight margin of error to consider. Brands listed on this page are ranked in the top twenty within the market and product category by total retail sales volume.

