Mar-2026
Sales
Trend
6-Month
Product Count
SKUs
Avg Price
YoY Sales Change
YoY Price Change
Market Insights Snapshot
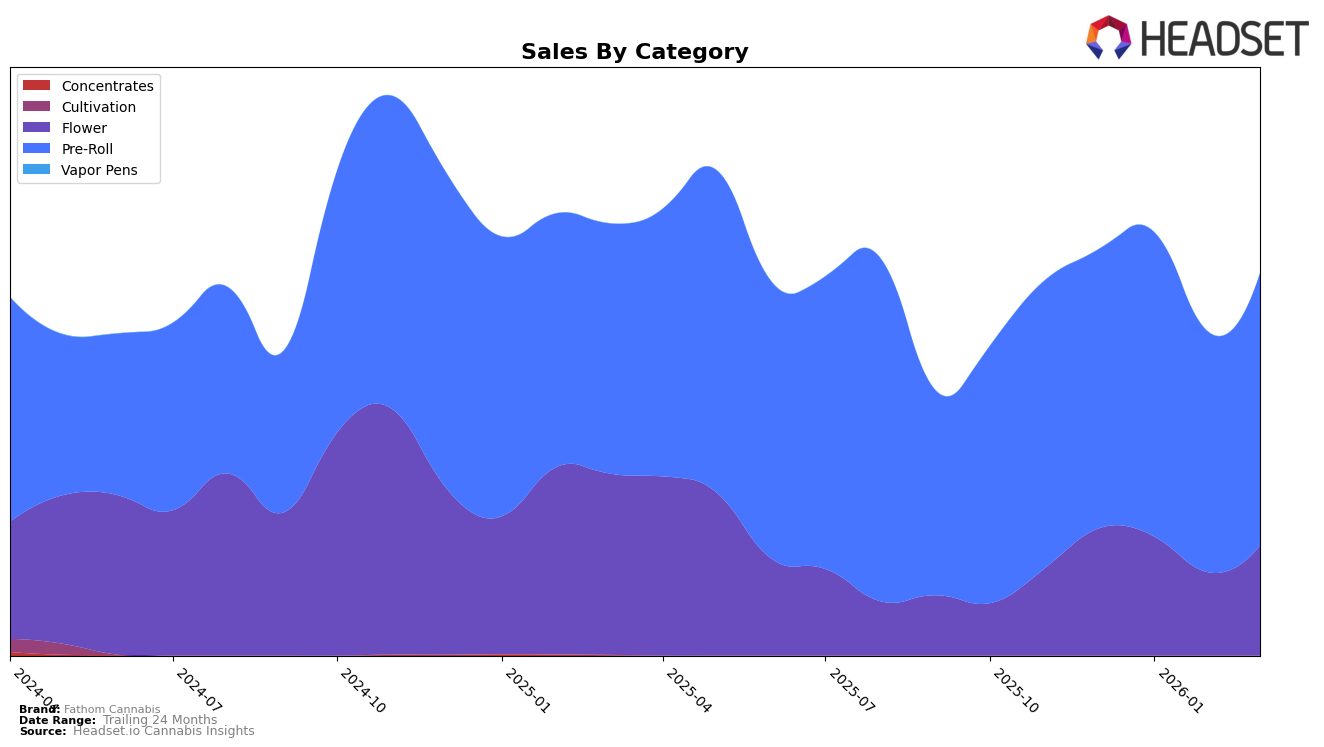
Fathom Cannabis has shown varied performance across different product categories and states. In the Massachusetts market, their Flower category experienced some challenges, as evidenced by their rankings outside the top 30, fluctuating between 83rd and 91st from December 2025 to March 2026. This indicates a struggle to maintain a competitive position in the Flower segment, which could be due to increased competition or shifts in consumer preferences. However, it's worth noting that despite these rankings, there was a slight rebound in March 2026, suggesting potential for recovery or strategic adjustments by the brand.
Conversely, Fathom Cannabis has maintained a stronger presence in the Pre-Roll category within Massachusetts. They consistently ranked within the top 30, with positions ranging from 20th to 26th over the same period. This stability in rankings highlights their competitive edge and possibly a more loyal customer base or effective marketing strategies in this segment. Their sales figures in the Pre-Roll category have shown some fluctuations but remained robust, indicating a relatively solid performance compared to the Flower category. This divergence in category performance underscores the importance of targeted strategies and market adaptation for Fathom Cannabis.
Competitive Landscape
In the Massachusetts pre-roll category, Fathom Cannabis has shown a consistent presence in the rankings, maintaining a rank of 24th in both February and March 2026, despite facing fierce competition. Notably, High Supply / Supply experienced a significant drop, falling from 8th in December 2025 to 25th by March 2026, indicating a potential opportunity for Fathom Cannabis to capture market share from a declining competitor. Meanwhile, Apotho Therapeutics demonstrated a strong upward trend, climbing from 30th in December 2025 to 22nd in March 2026, which could pose a competitive challenge. Farmer's Cut also showed resilience, moving from 27th in February 2026 to 23rd in March 2026, suggesting a competitive landscape that requires strategic positioning for Fathom Cannabis. Despite these dynamics, Fathom Cannabis's sales have shown a positive trajectory from February to March 2026, indicating a potential for growth if they can leverage the shifts in competitor rankings effectively.

Notable Products
In March 2026, the top-performing product for Fathom Cannabis was Shoki Pre-Roll (1g) in the Pre-Roll category, maintaining its first-place ranking consistently from December 2025 through March 2026, with sales of 6664 units. Deep Space Pre-Roll (1g) emerged as a strong contender, securing the second position in March, despite not being ranked in the previous months. Papaya Runtz Pre-Roll (1g) showed significant improvement, moving up to third place from fifth in February 2026. Superboof Orange Pre-Roll (1g) held the fourth position, showing a slight decline from its third-place ranking in January 2026. Deluxe Sugar Cane Pre-Roll (1g) entered the rankings for the first time in March 2026, capturing the fifth spot.
Top Selling Cannabis Brands
Data for this report comes from real-time sales reporting by participating cannabis retailers via their point-of-sale systems, which are linked up with Headset’s business intelligence software. Headset’s data is very reliable, as it comes digitally direct from our partner retailers. However, the potential does exist for misreporting in the instance of duplicates, incorrectly classified products, inaccurate entry of products into point-of-sale systems, or even simple human error at the point of purchase. Thus, there is a slight margin of error to consider. Brands listed on this page are ranked in the top twenty within the market and product category by total retail sales volume.

