Jun-2026
Sales
Trend
6-Month
Product Count
SKUs
Avg Price
YoY Sales Change
YoY Price Change
Market Insights Snapshot
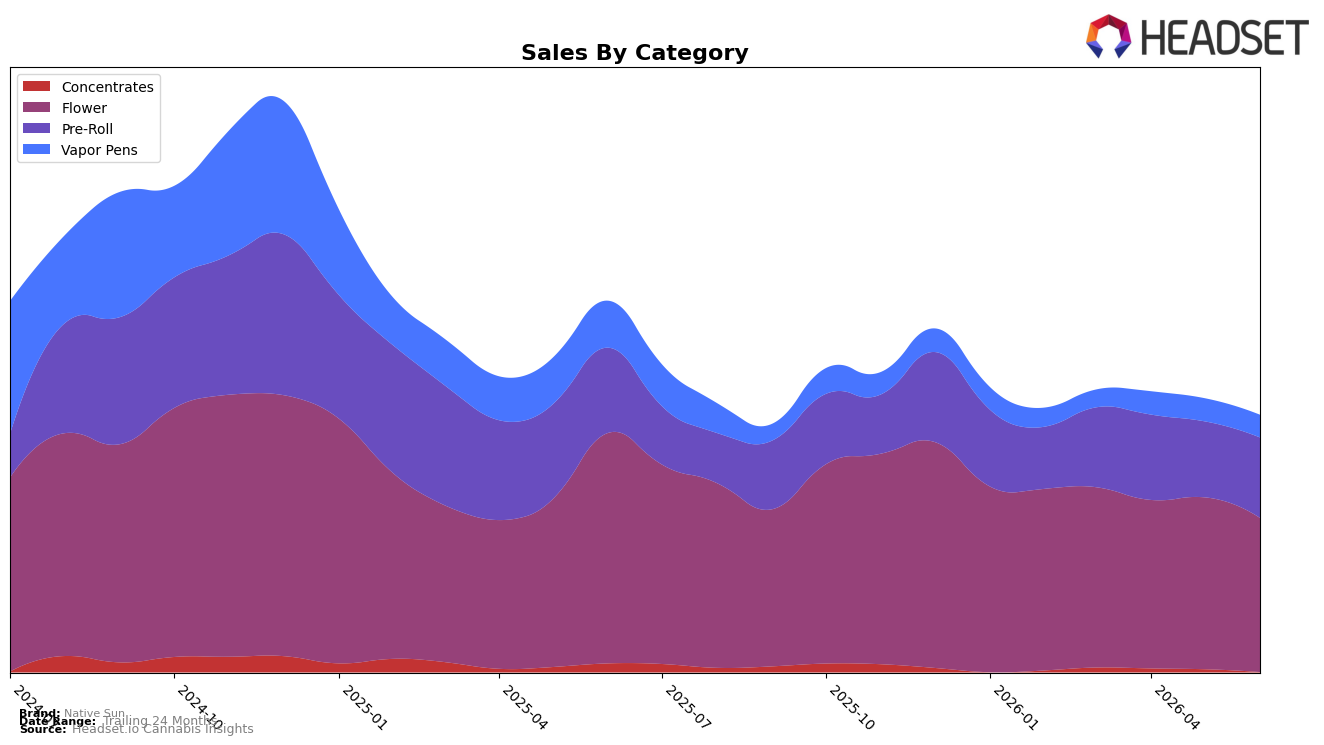
In June 2026, Native Sun’s mix concentrated further into Flower at 58.1% share while that category fell 32.7% year over year and 10.1% month over month, pulling overall sales down 29.6% YoY despite a 9.6% YoY rise in average price. Pre-Roll expanded to 30.9% share with sales up 5.6% MoM but still down 5.3% YoY, while Vapor Pens contracted to 9.6% share with a 48.2% YoY decline and a 1.6% MoM dip; Concentrates slid to 1.4% share with a 69.3% YoY drop and a 42.3% MoM decline. With Flower ranked 20th in Massachusetts and the mix overweight that category, the pattern implies concentration risk: incremental MoM gains in Pre-Roll are not yet offsetting double‑digit MoM declines in Flower and Concentrates.
The shift suggests a need to rebalance toward formats showing relative momentum, as a 5.6% MoM lift in Pre-Roll against a 10.1% MoM decline in Flower widens the opportunity gap while preserving basket traffic at lower price points ($10.23 average in Pre-Roll versus $30.31 in Flower). With Vapor Pens down 48.2% YoY but only 1.6% MoM, stabilization there could recapture mix if paired with targeted pricing around the current $41.49 average, whereas a 42.3% MoM slide in Concentrates at a $46.23 average price implies promotional inefficiency rather than demand elasticity; combined with a 20th-place Flower rank, the data imply that Native Sun’s positioning will improve by shifting 3–5 share points from Flower toward Pre-Roll and selective Vapor Pens to mitigate volatility and protect share.
Competitive Landscape
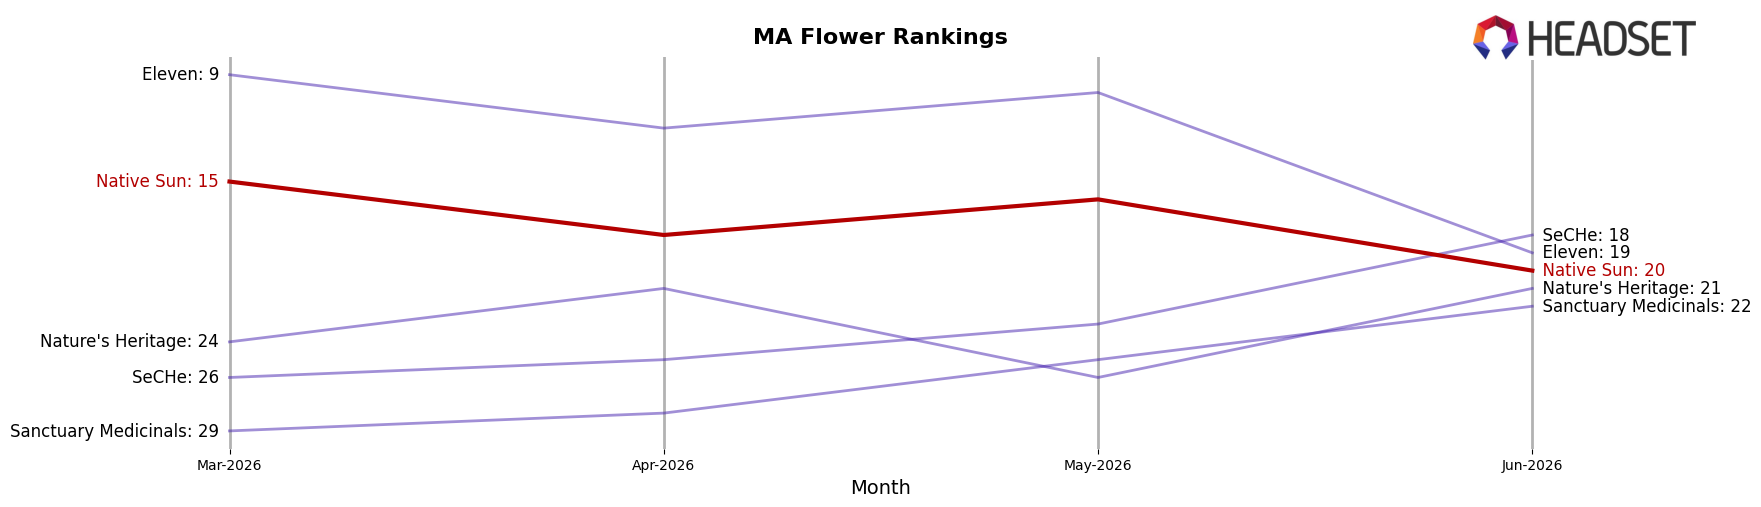
Native Sun is ranked #20 in Massachusetts Flower for June 2026, down 8 positions year over year from #12, and 5 spots lower than March 2026 when it was #15; this retracement contrasts with a prior peak of #9 in December 2024 and occurs while Farmer's Cut advanced from #3 to #1 and Root & Bloom jumped from #16 to #5 with 158.9% YoY sales growth, indicating share is consolidating toward faster risers. The divergence versus Simply Herb, which slipped from #1 to #2 with a 1.6% YoY sales decline while still holding a top-2 slot, and High Supply / Supply, which moved from #5 to #4 alongside 16.7% YoY sales growth, suggests Native Sun’s relative decline is driven more by competitor momentum than broad category softness; the trajectory implies that without a rank recovery toward the teens within the next quarter, reattaining a top-10 position will be structurally harder as leaders widen the gap.
Notable Products
Larry Berry Pre-Roll (1g) led June 2026 with a 74.3% month-over-month jump and the number 1 rank, while Kuzco's Poison Pre-Roll (1g) slid 12.5% to rank 4. Blueberry Muffin (3.5g) held rank 2 on a flat 0.6% MoM, and Kuzco's Poison (3.5g) in Flower inched up 4.5% at rank 7. With four of the top ten coming from Pre-Roll, the mix points to a pivot toward quick-consumption formats using Flower stalwarts for stability.
Top Selling Cannabis Brands
Data for this report comes from real-time sales reporting by participating cannabis retailers via their point-of-sale systems, which are linked up with Headset’s business intelligence software. Headset’s data is very reliable, as it comes digitally direct from our partner retailers. However, the potential does exist for misreporting in the instance of duplicates, incorrectly classified products, inaccurate entry of products into point-of-sale systems, or even simple human error at the point of purchase. Thus, there is a slight margin of error to consider. Brands listed on this page are ranked in the top twenty within the market and product category by total retail sales volume.

