.svg)

Sep-2026
Sales
Trend
6-Month
Product Count
SKUs
Avg Price
YoY Sales Change
YoY Price Change


Market Insights Snapshot
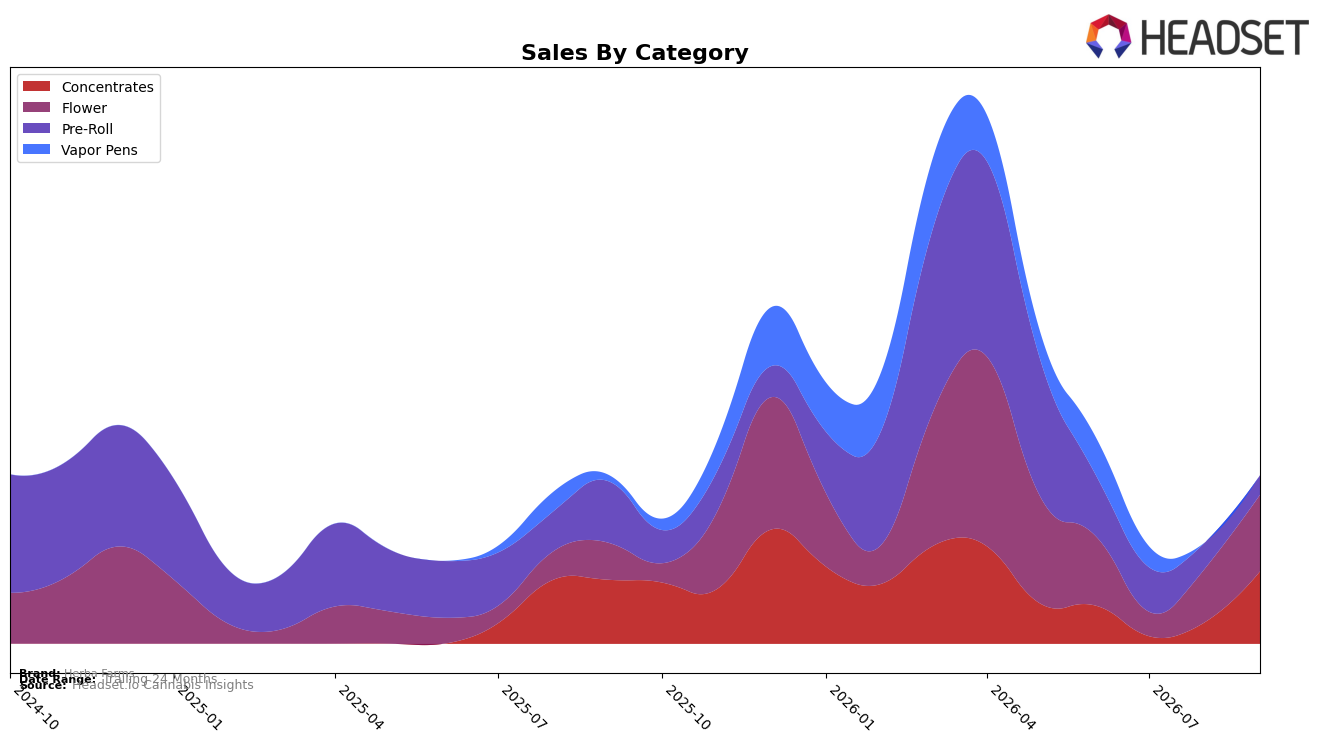
In September 2026, Herba Farms shifted its category mix toward higher-growth segments: Flower rose to 45.43% share with 107.12% year-over-year growth and 43.45% month-over-month, while Concentrates climbed to 43.04% share on 13.07% year-over-year and 238.52% month-over-month gains; by contrast, Pre-Roll fell to 11.53% share with -68.41% year-over-year and -25.41% month-over-month declines. Despite brand-level sales down 25.44% year-over-year and average price up 9.45% year-over-year to $24.42, the rank of 29 in Flower in Saskatchewan suggests momentum is concentrated in a few SKUs rather than broad-based, implying the mix is consolidating into Flower and Concentrates as Pre-Roll contracts.
The surge in Concentrates month-over-month at 238.52% alongside Flower’s 43.45% month-over-month increase, paired with Pre-Roll’s -25.41% month-over-month erosion and a 11.53% share, implies Herba Farms is pivoting toward potency-led formats and away from value-led formats at current pricing. With a 24-month sales lift of 23.60% but a current-year drop of 25.44%, and a category rank of 29 in Flower in Saskatchewan, the brand is trading near the middle tier; the pattern points to a repositioning bet on Flower and Concentrates to rebuild velocity while Pre-Roll rationalization limits near-term breadth.
Competitive Landscape
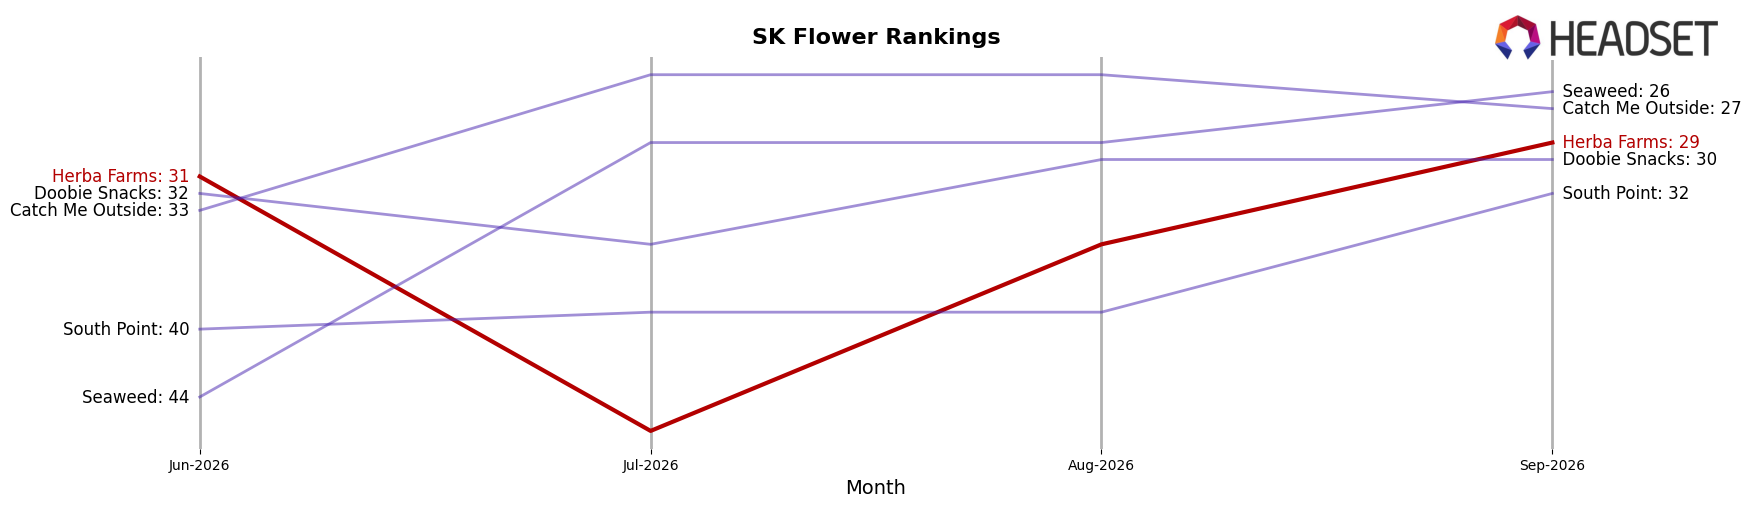
Herba Farms sits at rank #29 in SK Flower in September 2026, improving 11 positions year over year from #40, but slipping 2 spots from June 2026’s #31 and far off its peak at #11 in April 2026; meanwhile, Back Forty / Back 40 Cannabis held at #1 year over year with sales up 22.8%, and Spinach climbed from #5 to #2 on 60.2% YoY sales growth. With Big Bag O' Buds moving from #6 to #3 and Zippy (Canada) jumping from #32 to #5 on 364.7% YoY growth, Herba Farms’ partial recovery (up 11 ranks YoY) but quarter-over-quarter softening (down 2 ranks in three months) implies a mid-pack rebound that is being outpaced by faster-rising leaders, requiring share-defense tactics to avoid sliding back toward the #40 tier.
Notable Products
Champagne Citrus (3.5g) posted the single most notable movement in September 2026, jumping 304.7% month over month to rank 2, while Sangria Shatter (1g) surged 254.7% to rank 1; by contrast, Space Gello (7g) fell 17.7% at rank 7. Four of the top ten are Pre-Roll SKUs, yet category momentum tilted toward Flower and Concentrates as the two highest ranks both came from outside Pre-Rolls, implying mix is shifting to higher-potency or value-size offerings.
Champagne Citrus (7g) declined 11.1% at rank 4 even as its smaller 3.5g counterpart ranked 2 with a 304.7% rise, suggesting demand consolidated into the lower-size format; concurrently, Ice Cream Sundae Pre-Roll 3-Pack (1.5g) dropped 66.5% at rank 9 while Blueberry Jam Pre-Roll 3-Pack (1.5g) fell 38.9% at rank 5. With Sangria Shatter (1g) leading the lineup and the 3.5g Flower format outrunning the 7g size, the mix points to consumers trading into premium potency or trial-friendly sizes rather than bulk Pre-Roll multipacks, even as total top-line dollars were led by a single Concentrates SKU at $57,242.
Top Selling Cannabis Brands






Data for this report comes from real-time sales reporting by participating cannabis retailers via their point-of-sale systems, which are linked up with Headset’s business intelligence software. Headset’s data is very reliable, as it comes digitally direct from our partner retailers. However, the potential does exist for misreporting in the instance of duplicates, incorrectly classified products, inaccurate entry of products into point-of-sale systems, or even simple human error at the point of purchase. Thus, there is a slight margin of error to consider. Brands listed on this page are ranked in the top twenty within the market and product category by total retail sales volume.

