.svg)


Market Insights Snapshot
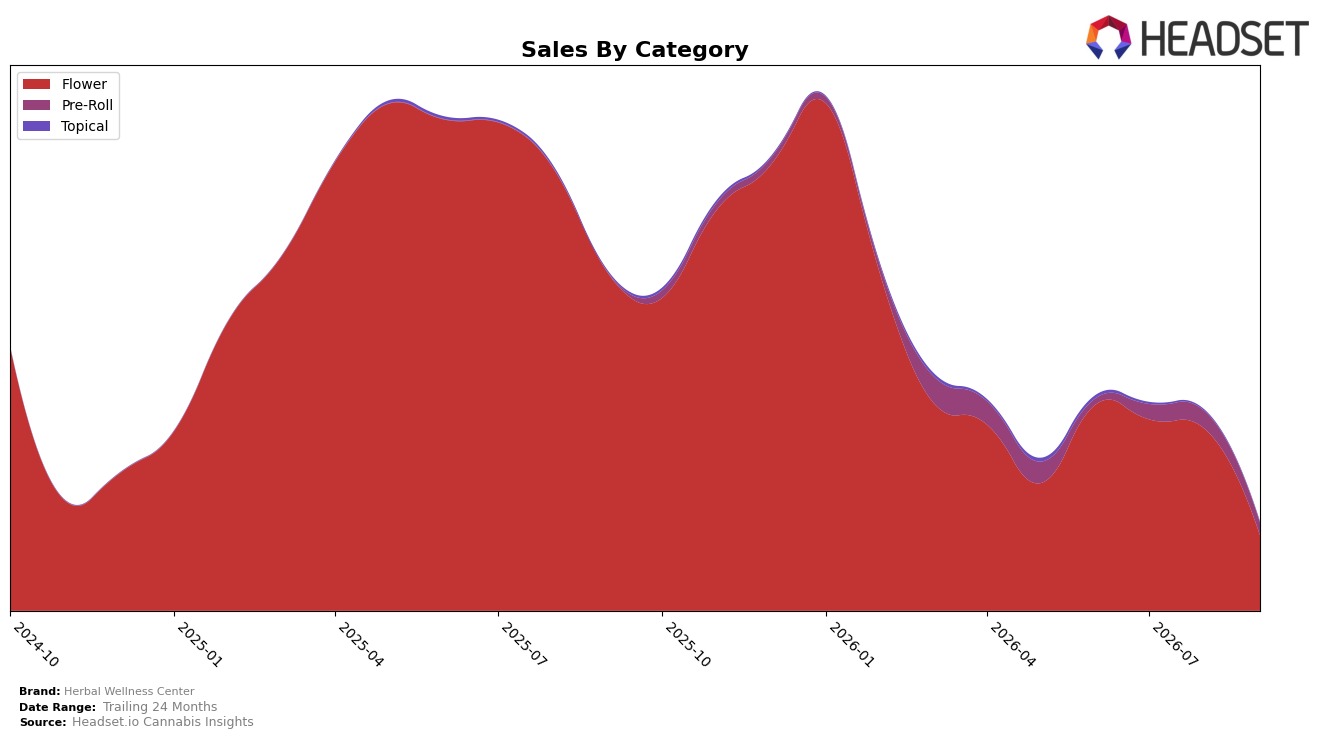
In September 2026, Herbal Wellness Center concentrated 85.09% of sales in Flower while Pre-Roll accounted for 13.95% and Topical 0.96%, indicating a narrow mix anchored in a single category. Flower contracted sharply with a year-over-year drop of 77.75% and a month-over-month decline of 58.71%, while Pre-Roll also fell 28.80% MoM and Topical decreased 15.72% MoM. The brand’s overall average price decreased 11.05% YoY to $18.65 even as Flower carried a higher category-level average price of $27.07, pointing to price compression alongside volume erosion. With Flower ranked 49th in Ohio and overall brand sales down 73.97% YoY, the pattern implies overexposure to a rapidly shrinking core category and insufficient offset from smaller lines.
The mix shift suggests that reliance on Flower at 85.09% share amid a 58.71% MoM decline is diluting the impact of comparatively smaller, less volatile categories; Topical’s 15.72% MoM pullback from a 0.96% base offers little cushion, and Pre-Roll’s 28.80% MoM decline does not provide diversification at 13.95% share. Given the 11.05% YoY average price reduction and a 77.75% YoY contraction in Flower, the brand appears to be trading down in price without gaining unit share, which, coupled with a 49 rank position in Ohio Flower, implies a need to rebalance toward categories with steadier month-over-month trajectories or to reposition within Flower to reduce volatility.
Competitive Landscape
Herbal Wellness Center sits at rank #49 in OH Flower in September 2026, sliding 30 positions year over year from #19 while dropping 14 spots since June 2026 from #35, and its peak at #16 in July 2025 frames a 33-place decline from that high; by contrast, Klutch Cannabis climbed to #1 with a 13-rank YoY rise and 162.4% sales growth, and Northwoods Cannabis moved to #5 with a 76-rank YoY jump alongside 105,837.8% sales growth, indicating that Herbal Wellness Center’s downward rank trajectory amid competitors’ upward mobility points to lost relative velocity that will require either assortment or activation shifts to regain share.

Notable Products
Oh My God (3.5g) led the movement in September 2026 with a -60.2% month-over-month drop while still holding rank 1, and R Rtz Pre-Roll (1g) fell -79.2% at rank 9; together these contractions point to volatility concentrated at the top and tail of the lineup. Flower occupies four of the top ten ranks while Pre-Roll takes another four, with YD Soda (14.15g) up 9.6% at rank 5 versus a flat-to-declining tilt in several Pre-Roll SKUs, implying mix protection is coming more from larger-pack Flower than singles despite Oh My God (3.5g)’s sharp decline. The product set is pivoting toward value-oriented Flower formats, with reliance on a single flagship easing as mid-pack sizes hold share even as a headline SKU retrenches.
Top Selling Cannabis Brands






Data for this report comes from real-time sales reporting by participating cannabis retailers via their point-of-sale systems, which are linked up with Headset’s business intelligence software. Headset’s data is very reliable, as it comes digitally direct from our partner retailers. However, the potential does exist for misreporting in the instance of duplicates, incorrectly classified products, inaccurate entry of products into point-of-sale systems, or even simple human error at the point of purchase. Thus, there is a slight margin of error to consider. Brands listed on this page are ranked in the top twenty within the market and product category by total retail sales volume.

