.svg)


Market Insights Snapshot
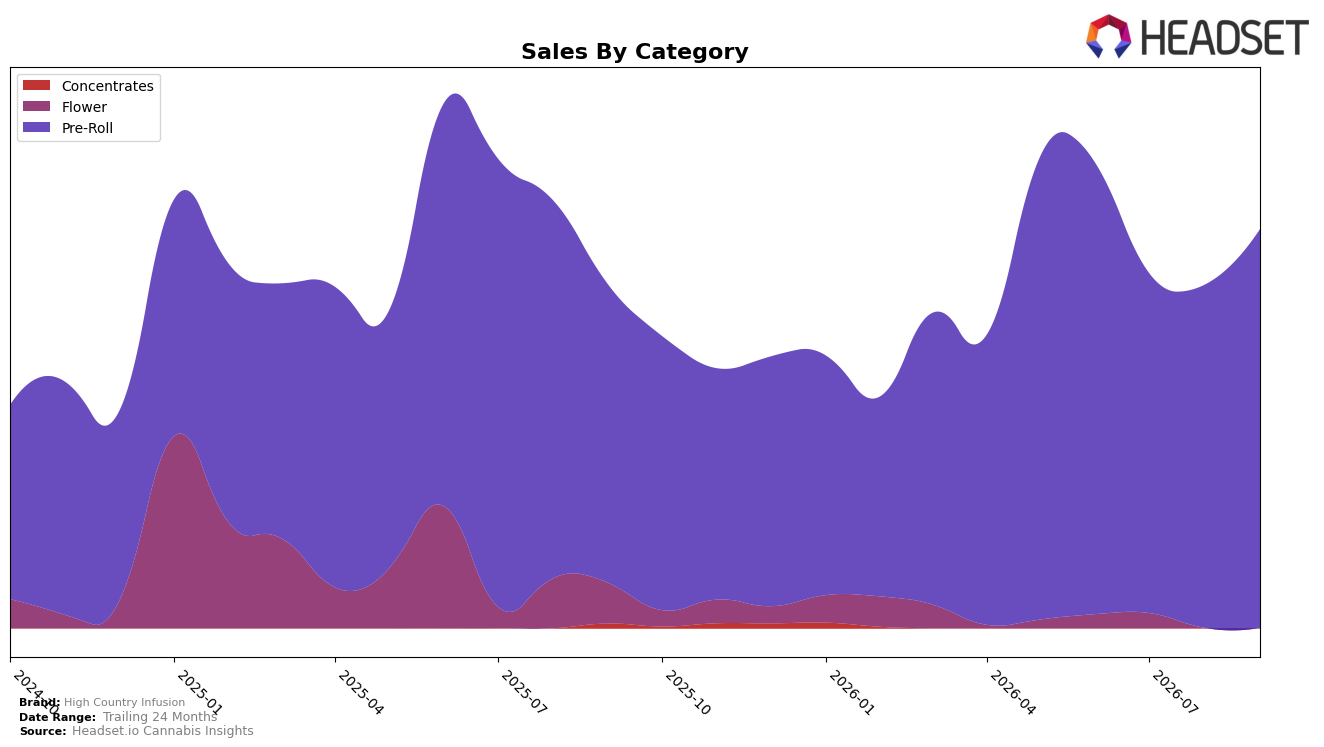
High Country Infusion operated as a single-category play in September 2026, with Pre-Roll at 100.0% of sales mix and a rank of 36 in Colorado Pre-Roll. Within that footprint, Pre-Roll sales rose 33.7% year over year and 16.2% month over month, while the brand-level sales increased 16.2% YoY and average price ticked up 0.4% YoY; together these indicate that volume, not price, drove most of the lift. The implication is that concentration in one category amplified the 16.2% MoM acceleration inside Pre-Roll, but the 36th rank places a ceiling on near-term share gains unless distribution or pack architecture expands.
The all-in Pre-Roll mix at 100.0% and the 0.4% YoY price increase point to a value-stable, volume-led stance, while 33.7% YoY growth against a 16.2% brand-level YoY suggests category momentum outpaced the broader brand baseline. Coupled with a 16.2% MoM gain within Pre-Roll at a 36 rank in Colorado, the pattern implies the brand’s positioning hinges on deepening velocity within existing SKUs rather than price-taking, with risk concentrated in a single-category dependency and upside tied to pushing rank into the low 30s through assortment and door growth.
Competitive Landscape
High Country Infusion sits at rank #36 in Colorado Pre-Roll for September 2026, improving 5 positions from #41 year over year, but slipping 5 spots from #31 in June 2026 and 8 from its peak at #28 in May 2026; meanwhile, category leaders shifted as Cali-Blaze climbed from #2 to #1 and Green Label Cannabis moved from #1 to #2, while Be One Kind surged from #22 to #4 on 463.7% YoY sales growth. The juxtaposition of a 5-rank YoY gain with a 5-rank decline since June 2026 indicates a mid-tier brand that benefited from longer-term recovery but is losing ground in recent months to faster-rising competitors, implying that without a near-term velocity shift, its trajectory points toward further crowd-out below the top 30.

Notable Products
Morning Dew Infused Pre-Roll 2-Pack (1g) posted the largest month-over-month surge at 178.1% and climbed to rank 2, while Sativa Rosin Infused Pre-Roll 5-Pack (2.5g) rose 86.3% to hold rank 1. In contrast, Runtz Buttonz Kief Infused Pre-Roll 2-Pack (1g) fell 70.8% to rank 8 and Sativa Kief Infused Pre-Roll 2-Pack (1g) declined 41.3% to rank 7, indicating a split between solventless and kief formats. Four of the top ten are 5-Pack solventless or pure melt SKUs, and Hybrid Rosin Infused Pre-Roll 5-Pack (2.5g) advanced 37.8% at rank 5, with the leader generating $14,620 in September 2026. The pattern implies High Country Infusion is consolidating around higher-priced, solventless multi-pack formats as growth engines while kief 2-Packs retrench.
Top Selling Cannabis Brands






Data for this report comes from real-time sales reporting by participating cannabis retailers via their point-of-sale systems, which are linked up with Headset’s business intelligence software. Headset’s data is very reliable, as it comes digitally direct from our partner retailers. However, the potential does exist for misreporting in the instance of duplicates, incorrectly classified products, inaccurate entry of products into point-of-sale systems, or even simple human error at the point of purchase. Thus, there is a slight margin of error to consider. Brands listed on this page are ranked in the top twenty within the market and product category by total retail sales volume.

