.svg)


Where to Buy
High Five (MO) is stocked at 131 licensed dispensaries across Missouri, Massachusetts, and New Mexico, 129 of them in Missouri, with the deepest coverage in Kansas City, St. Louis, Springfield, Columbia, and Joplin. Search by ZIP code or city below to find the closest one, or filter by product type if you are after a specific format.
Market Insights Snapshot
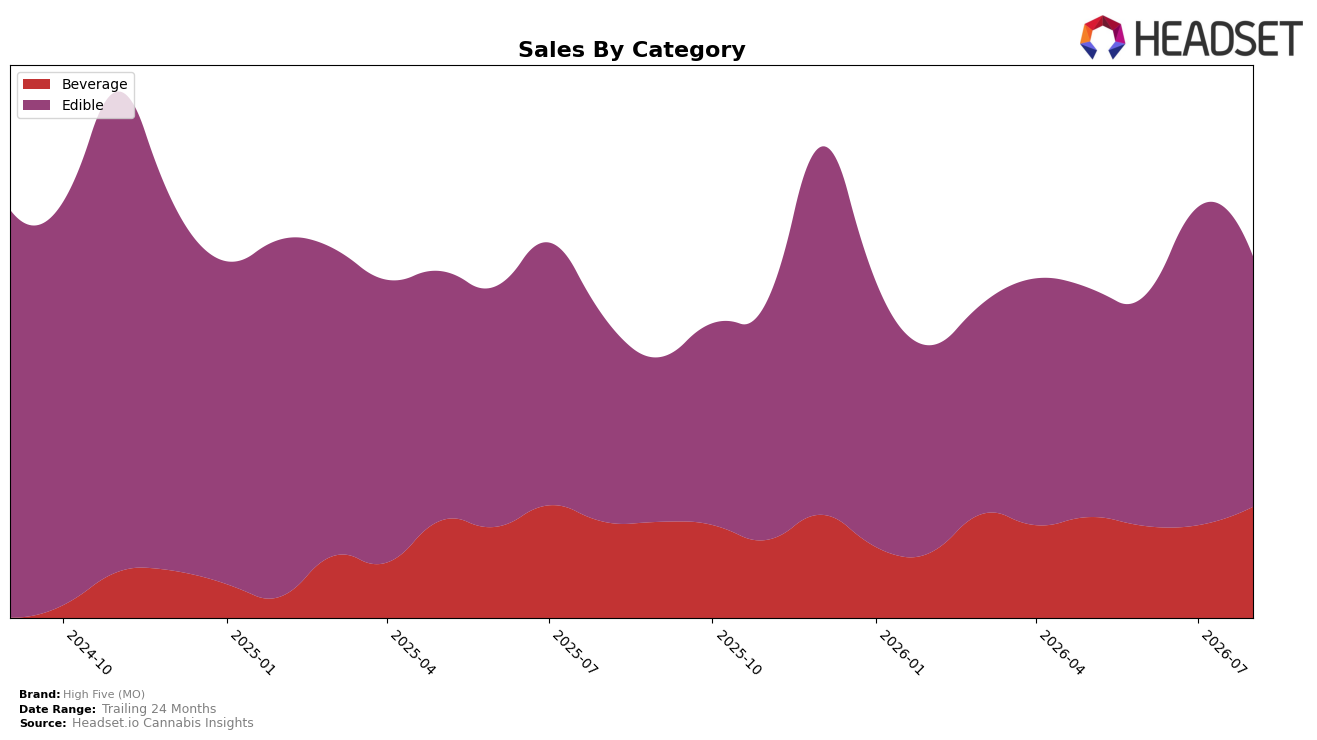
High Five (MO) concentrated 65.92% of August 2026 sales in Edible with 18.85% year-over-year growth, while Beverage held 34.08% with 11.22% year-over-year growth; simultaneously, Edible declined 19.07% month-over-month as Beverage expanded 14.14% month-over-month. The brand’s overall average price rose 8.14% year-over-year to $26.71, with category price points diverging at $25.85 in Edible and $28.55 in Beverage, indicating mix and pricing shifts amplifying revenue despite Edible’s monthly pullback. Taken together with a rank of 30 in Edible in Missouri, the pattern implies reliance on Edible for scale while near-term momentum currently tilts toward Beverage, creating a potential rebalancing window if monthly Beverage gains persist.
The combination of a 19.07% month-over-month contraction in Edible against a 14.14% month-over-month expansion in Beverage, layered on 18.85% and 11.22% year-over-year growth respectively, implies that High Five (MO) is insulating total performance by leaning on two differently timed demand curves. With Edible anchoring share at 65.92% but priced below Beverage by 10.46% ($25.85 vs. $28.55), the August 2026 mix suggests incremental margin headroom from Beverage if its share rises above 34.08% without eroding Edible’s baseline. Given the 30th rank in Missouri Edible and a brand-level 16.13% year-over-year sales increase, the positioning implication is to treat Beverage as a short-cycle volume stabilizer while defending Edible rank, using price architecture to manage trade-offs rather than chasing share uniformly across categories.
Competitive Landscape
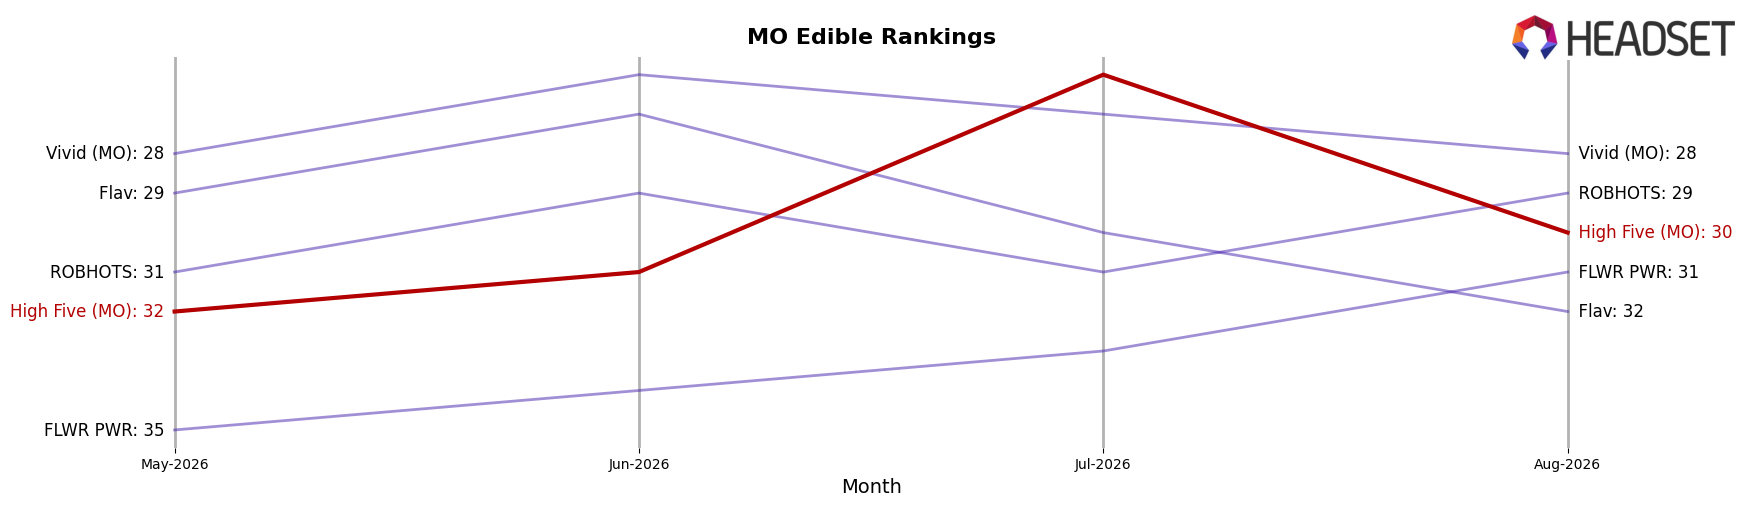
High Five (MO) sits at rank #30 in MO Edible for August 2026, a 4-position improvement from #34 year over year, but down 2 positions from #32 in May 2026, while still trailing its peak of #18 from September 2024; meanwhile, Good Day Farm edged up to #1 from #2 with +5.41% YoY sales, and Gron / Grön slipped from #1 to #2 with -7.83% YoY sales, indicating the top tier is rotating as mid-pack brands jostle. Against steadier incumbents like Wyld holding #3 YoY with -10.75% YoY sales and Smokiez Edibles holding #4 with -6.66% YoY sales, and a mover like Good Taste jumping from #8 to #5 on +34.59% YoY sales, High Five (MO)’s YoY climb of 4 ranks alongside a 2-rank slip over the last three months implies a recovery trajectory that is positive year over year but losing near-term momentum against faster risers.
Notable Products
Sour Green Apple Gummies 20-Pack (500mg) led the movement in August 2026 with a -33.6% MoM drop while sitting at rank 10, and THC/CBN 1:1 Sweet Dark Cherry Gummies 20-Pack (100mg THC, 100mg CBN) also contracted by -20.1% at rank 1. In contrast, the Beverage line lifted the middle of the table with Stiribles - Unflavorable Pure Dissolvable Powder 20-Pack (300mg) up 29.4% at rank 7 and the 500mg Stiribles up 18.3% at rank 5, while the 100mg Stiribles rose 35.2% at rank 3. Four of the top ten are Edible SKUs yet three Beverage Stiribles occupy ranks 3, 5, and 7, and the CBD/THC 1:1 Sweet Blood Orange Gummies 20-Pack (100mg CBD, 100mg THC) fell -20.9% at rank 6 alongside the CBG/THC 3:1 Sweet Citrus Punch Gummies 20-Pack (300mg CBG,100mg THC) at -25.1% and rank 9. The pattern implies a pivot toward functional drink additives as Edible high-dose and minor-cannabinoid gummies retreat despite one Edible holding rank 1, tilting assortment strategy toward Beverage growth pockets over $29,000 coming from a single high-dose gummy anchor.
Top Selling Cannabis Brands






Data for this report comes from real-time sales reporting by participating cannabis retailers via their point-of-sale systems, which are linked up with Headset’s business intelligence software. Headset’s data is very reliable, as it comes digitally direct from our partner retailers. However, the potential does exist for misreporting in the instance of duplicates, incorrectly classified products, inaccurate entry of products into point-of-sale systems, or even simple human error at the point of purchase. Thus, there is a slight margin of error to consider. Brands listed on this page are ranked in the top twenty within the market and product category by total retail sales volume.

