Jun-2026
Sales
Trend
6-Month
Product Count
SKUs
Avg Price
YoY Sales Change
YoY Price Change
Market Insights Snapshot
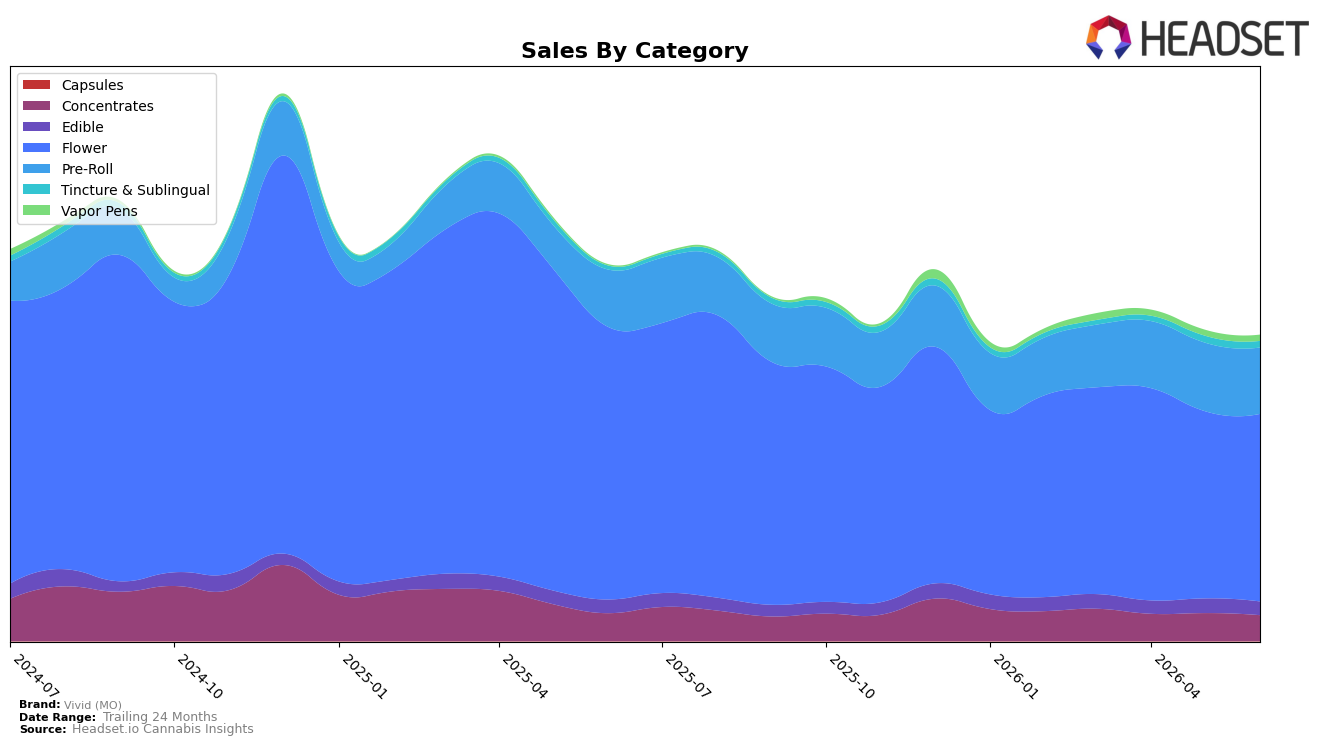
Vivid (MO) concentrated 61.50% of June 2026 sales in Flower, where year-over-year sales declined 31.23% but month-over-month inched up 0.13%, while Pre-Roll held 21.69% share with a 15.80% year-over-year increase and a 3.16% month-over-month dip. Smaller lines moved unevenly: Concentrates at 8.44% fell 7.18% year-over-year and 7.49% month-over-month, Edible at 4.38% was up 0.21% year-over-year but down 6.76% month-over-month, and Tincture & Sublingual at 2.04% surged 69.30% year-over-year despite a 4.95% month-over-month decline. Vapor Pens, though just 1.95% share, jumped 484.19% year-over-year and rose 5.05% month-over-month, contrasting with the brand’s overall 18.81% year-over-year sales decline and a 4.97% year-over-year average price decrease to $25.86; the pattern implies a portfolio leaning on a large but contracting Flower base while smaller formats, especially inhalables, provide pockets of velocity.
With Flower ranked 6 in Missouri and carrying 61.50% of mix amid a 31.23% year-over-year drop, the brand’s positioning hinges on stabilizing this anchor while using Pre-Roll’s 15.80% year-over-year growth and Vapor Pens’ 484.19% surge to diversify demand. The concurrent 7.49% month-over-month slide in Concentrates and 6.76% month-over-month slide in Edible signal a narrowing of non-inhalable pull as average price fell 4.97% year-over-year, suggesting that near-term share defense rests on trading consumers within inhalable formats rather than expanding into ingestibles; the implication is a need to pivot assortment and pricing toward Pre-Roll and Vapor Pens to offset Flower volatility while protecting rank in the core category.
Competitive Landscape
Vivid (MO) sits at rank #6 in MO Flower in June 2026, slipping 2 positions from #4 year over year while improving 1 spot from #7 since March 2026; that contrasts with Sinse Cannabis rising to #2 from #5 as its sales grew 33.2% year over year, and Amaze Cannabis reaching #4 from #6 alongside a 43.8% sales increase, even as category leader Flora Farms held #1 with a 5.1% sales decline. Against this mix—where one top competitor contracted by 5.1% yet retained #1 and two others advanced on 28.3%–43.8% gains—Vivid (MO)’s fall from its April 2025 peak of #3 to #6 implies share is being redistributed toward faster-growing rivals rather than lifted by category expansion.

Notable Products
Alien Mintz Pre-Roll (1g) posted the steepest move in June 2026 with a -65.9% month-over-month drop as it slid to rank 8, while Florida Kush (3.5g) countered with a +55.6% surge to rank 1, indicating a sharp shift in demand from pre-rolls toward premium flower. Florida Kush Pre-Roll (1g) rose +46.5% to rank 2 even as Alien Mintz (3.5g) in flower dipped -5.1% at rank 4, and six of the top ten are Pre-Roll SKUs, concentrating mix risk in a single format despite split trajectories. The $320,783 posted by Florida Kush (3.5g) alongside a -8.4% move for Alien Mintz Pre-Roll 5-Pack (2.5g) at rank 9 suggests Vivid (MO) is consolidating volume into a flagship flower SKU while trimming underperforming Alien Mintz pre-roll variants. The pattern implies a portfolio pivot toward fewer, higher-velocity hero items in flower with selective pre-roll support rather than broad strain-line extensions.
Top Selling Cannabis Brands
Data for this report comes from real-time sales reporting by participating cannabis retailers via their point-of-sale systems, which are linked up with Headset’s business intelligence software. Headset’s data is very reliable, as it comes digitally direct from our partner retailers. However, the potential does exist for misreporting in the instance of duplicates, incorrectly classified products, inaccurate entry of products into point-of-sale systems, or even simple human error at the point of purchase. Thus, there is a slight margin of error to consider. Brands listed on this page are ranked in the top twenty within the market and product category by total retail sales volume.

