.svg)

Aug-2026
Sales
Trend
6-Month
Product Count
SKUs
Avg Price
YoY Sales Change
YoY Price Change


Where to Buy
Hight is stocked at 56 licensed dispensaries across New Jersey, with the deepest coverage in Jersey City, Atlantic City, Highland Park, Newark, and Runnemede. Search by ZIP code or city below to find the closest one, or filter by product type if you are after a specific format.
Market Insights Snapshot
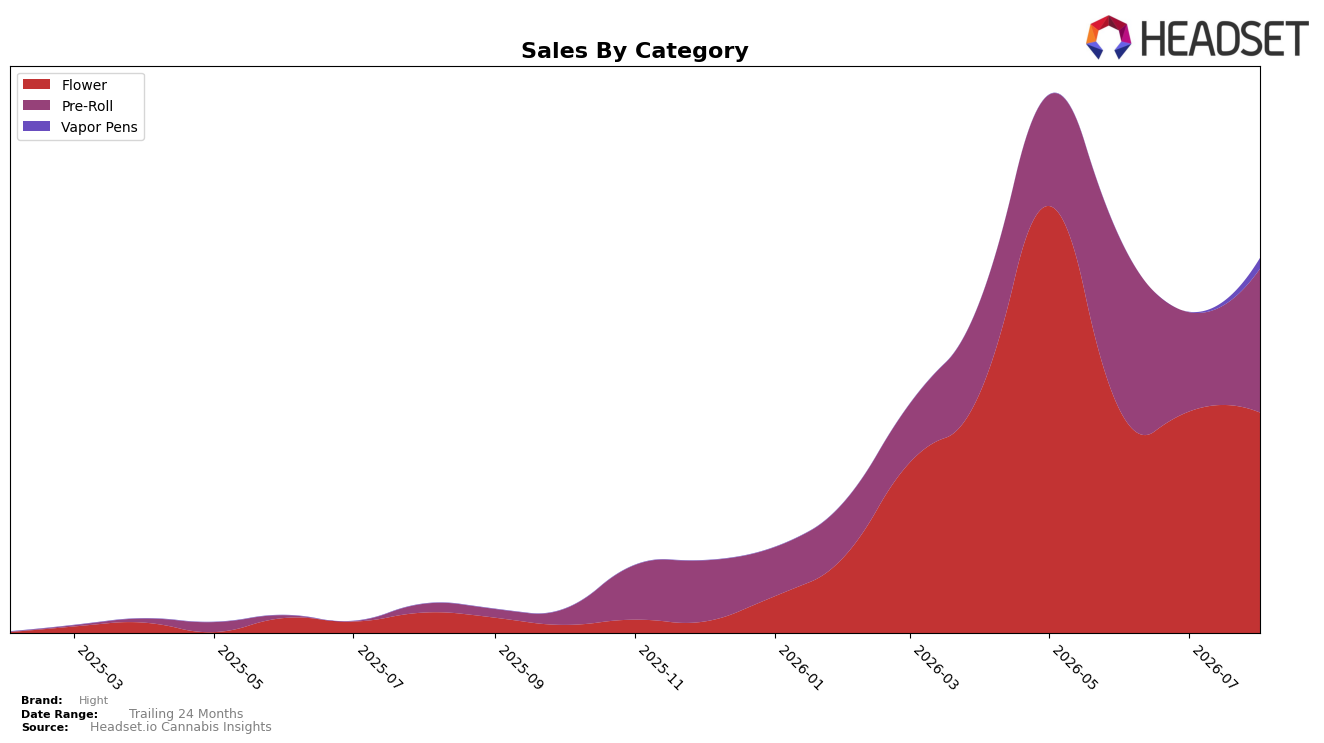
In August 2026, Hight concentrated 58.86% of sales in Flower and 38.37% in Pre-Roll, leaving 2.77% in Vapor Pens; within this mix, Flower slipped by 0.46% month over month while Pre-Roll expanded by 44.99% month over month, and Flower advanced 995.13% year over year versus a 1,612.22% year-over-year surge in Pre-Roll. The average price fell 55.41% year over year to $18.81 while Flower averaged $23.44 and Pre-Roll averaged $14.09, a pricing gap that aligns with the brand’s 1,213.13% year-over-year sales growth concentrated in lower-priced formats; this implies Hight is pivoting volume toward accessible price points as Pre-Roll gains share against a flat-to-down Flower base.
Hight’s 50th rank in Flower in New Jersey, combined with a 0.46% month-over-month decline in Flower against a 44.99% month-over-month rise in Pre-Roll, indicates that momentum is accruing in Pre-Roll rather than in the ranked flagship category, and the 58.86% Flower share could compress if Pre-Roll continues to compound share gains. With a 55.41% year-over-year drop in average price alongside 1,213.13% year-over-year sales growth, the mix shift toward a $14.09 Pre-Roll price point versus $23.44 in Flower suggests a scale-through-affordability positioning where basket frequency and unit velocity, not premium pricing, drive rank improvements over time.
Competitive Landscape
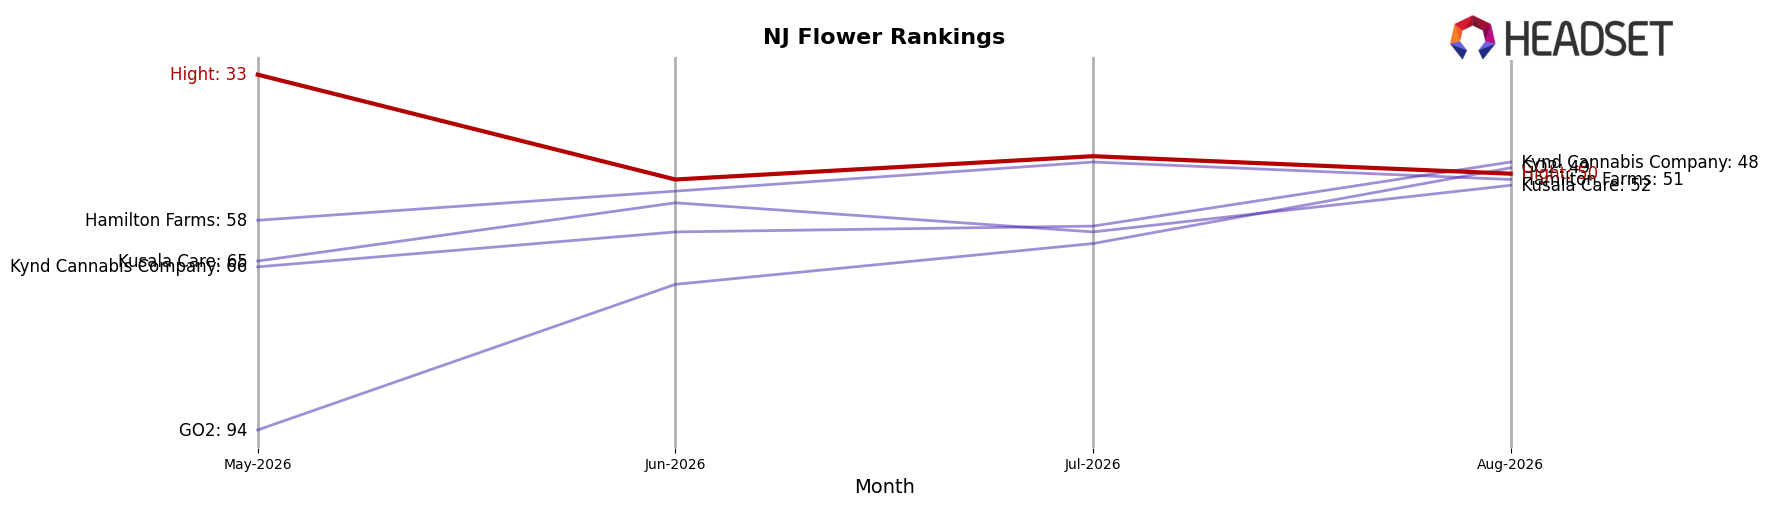
Hight sits at rank #50 in New Jersey Flower in August 2026, improving 39 positions from #89 year over year but falling 17 spots from #33 since May 2026; that path contrasts with Ozone holding #1 while sliding from #2 year over year and posting a -18.5% sales change, and with Good Green climbing from #10 to #3 alongside a 91.6% sales increase, indicating Hight’s rebound is broad-based YoY yet losing relative momentum versus faster risers and entrenched leaders, which implies the brand’s trajectory points to mid-pack stabilization unless near-term share gains reverse the 17-rank slide.
Notable Products
Pineapple Donut Smalls (7g) leads August 2026 with a 4.8% month-over-month lift at rank 1, while Ouzo (3.5g) adds a smaller 3.0% increase at rank 4, and four of the top ten are Flower SKUs concentrated between ranks 1 and 6; this tilt toward Flower at the very top implies that incremental gains in flagship strains are doing more work than any breakout in secondary formats. Morning Diesel Pre-Roll 2-Pack (1g) holds rank 2 without a reported month-over-month rate, and the Morning Diesel Pre-Roll 5-Pack (2.5g) sits at rank 8 with $11,714, suggesting Pre-Roll depth is present but not translating into upward rank momentum; the mix points to a portfolio relying on stable Flower anchors with Pre-Rolls sustaining breadth rather than driving share shifts.
Top Selling Cannabis Brands






Data for this report comes from real-time sales reporting by participating cannabis retailers via their point-of-sale systems, which are linked up with Headset’s business intelligence software. Headset’s data is very reliable, as it comes digitally direct from our partner retailers. However, the potential does exist for misreporting in the instance of duplicates, incorrectly classified products, inaccurate entry of products into point-of-sale systems, or even simple human error at the point of purchase. Thus, there is a slight margin of error to consider. Brands listed on this page are ranked in the top twenty within the market and product category by total retail sales volume.

