Jun-2026
Sales
Trend
6-Month
Product Count
SKUs
Avg Price
YoY Sales Change
YoY Price Change
Market Insights Snapshot
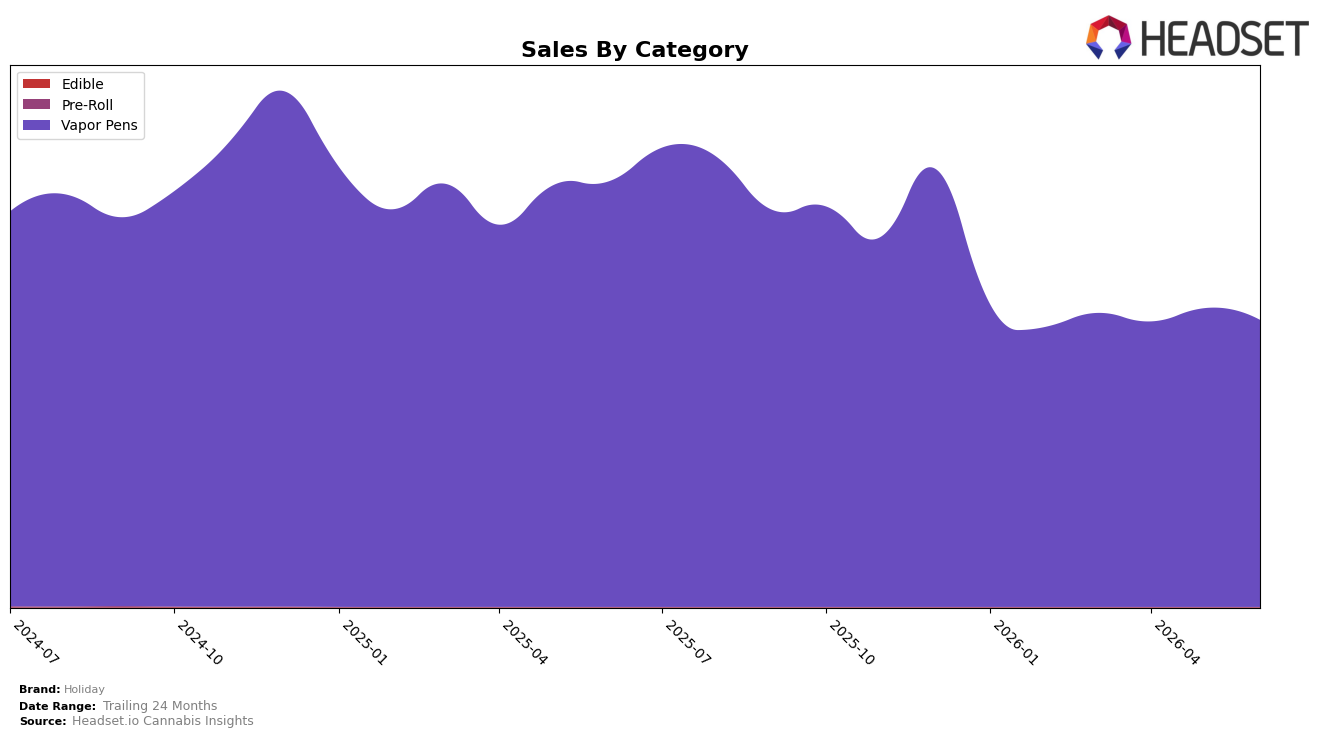
Holiday operated as a single-category brand in June 2026, with Vapor Pens accounting for 100.0% of sales and posting a year-over-year decline of 32.6% and a month-over-month decline of 3.9%. Within this category concentration, the brand’s average price fell 17.1% year over year to $34.22, while overall brand sales also contracted 32.6% year over year, indicating that mix did not cushion performance. The pattern implies that Holiday’s exposure to one category amplifies volatility: a full reliance on Vapor Pens ties outcomes directly to category pressure rather than offsetting shifts from other formats.
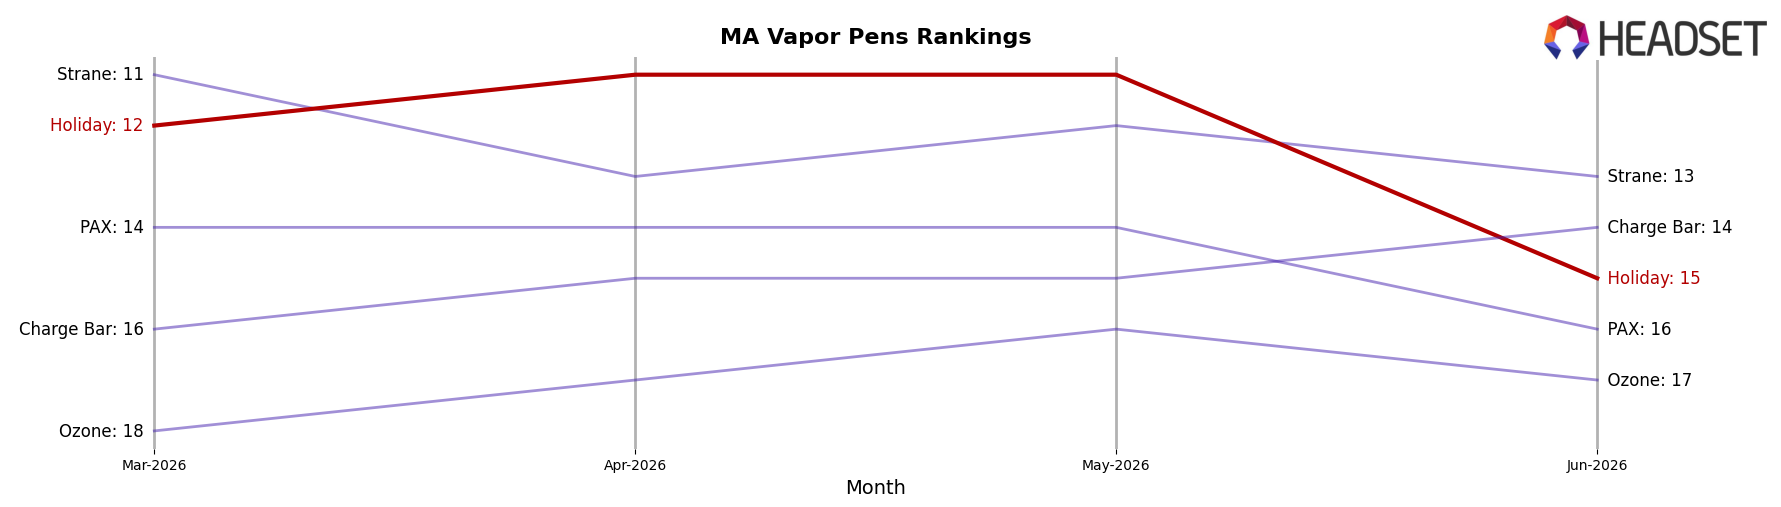
Positioning-wise, a 100.0% Vapor Pens mix paired with a June 2026 rank of 15 in Massachusetts Vapor Pens, alongside a 3.9% month-over-month sales drop and a 17.1% year-over-year price reduction, signals a price-led defense rather than share capture. With brand sales down 32.6% year over year and 21.5% over 24 months, the current stance likely trades margin for retention without elevating rank, implying Holiday must either diversify beyond Vapor Pens or sharpen differentiated value within the format to avoid further erosion tied to category-wide pricing compression.
Competitive Landscape
Holiday sits at rank 15 in Massachusetts Vapor Pens in June 2026, down 8 positions year over year from rank 7 while sliding 3 spots since March 2026 from rank 12, and its prior peak was rank 7 in August 2025; meanwhile, Fernway held at rank 1 with a 56.41% year-over-year sales increase as Select stayed at rank 2 with a -10.32% sales decline, and Dime Industries advanced to rank 5 from rank 9 year over year on 81.99% growth, indicating Holiday’s downward rank trajectory is less about broad category contraction and more about share being captured by faster-rising competitors.
Notable Products
Weekend Paloma Mocktail Distillate H-Bar Disposable (1g) posted the steepest move in June 2026 with a -14.3% MoM decline at rank 6, while the category leader Golden Hour Distillate H-Bar Disposable (1g) slipped -9.4% yet held rank 1. In contrast, CBN/THC 2:1 Nightcap Grapevine Distillate H-Bar Disposable (1g) rose 14.4% MoM at rank 10 and Happy Camper Distillate H-Bar Disposable (1g) gained 7.6% at rank 2, indicating consumer pull toward mood- or effect-led variants even as a top SKU softened. With all ten top spots concentrated in Vapor Pens and only one sub-gram launch visible at rank 8, mix is consolidating around 1g disposables rather than fragmenting into smaller sizes. The pattern implies Holiday is leaning into a portfolio where flagship flavors anchor share while functional or occasion-based SKUs absorb incremental demand, suggesting commercial focus on depth within Vapor Pens over breadth across formats.
Top Selling Cannabis Brands
Data for this report comes from real-time sales reporting by participating cannabis retailers via their point-of-sale systems, which are linked up with Headset’s business intelligence software. Headset’s data is very reliable, as it comes digitally direct from our partner retailers. However, the potential does exist for misreporting in the instance of duplicates, incorrectly classified products, inaccurate entry of products into point-of-sale systems, or even simple human error at the point of purchase. Thus, there is a slight margin of error to consider. Brands listed on this page are ranked in the top twenty within the market and product category by total retail sales volume.

