Jun-2026
Sales
Trend
6-Month
Product Count
SKUs
Avg Price
YoY Sales Change
YoY Price Change
Market Insights Snapshot
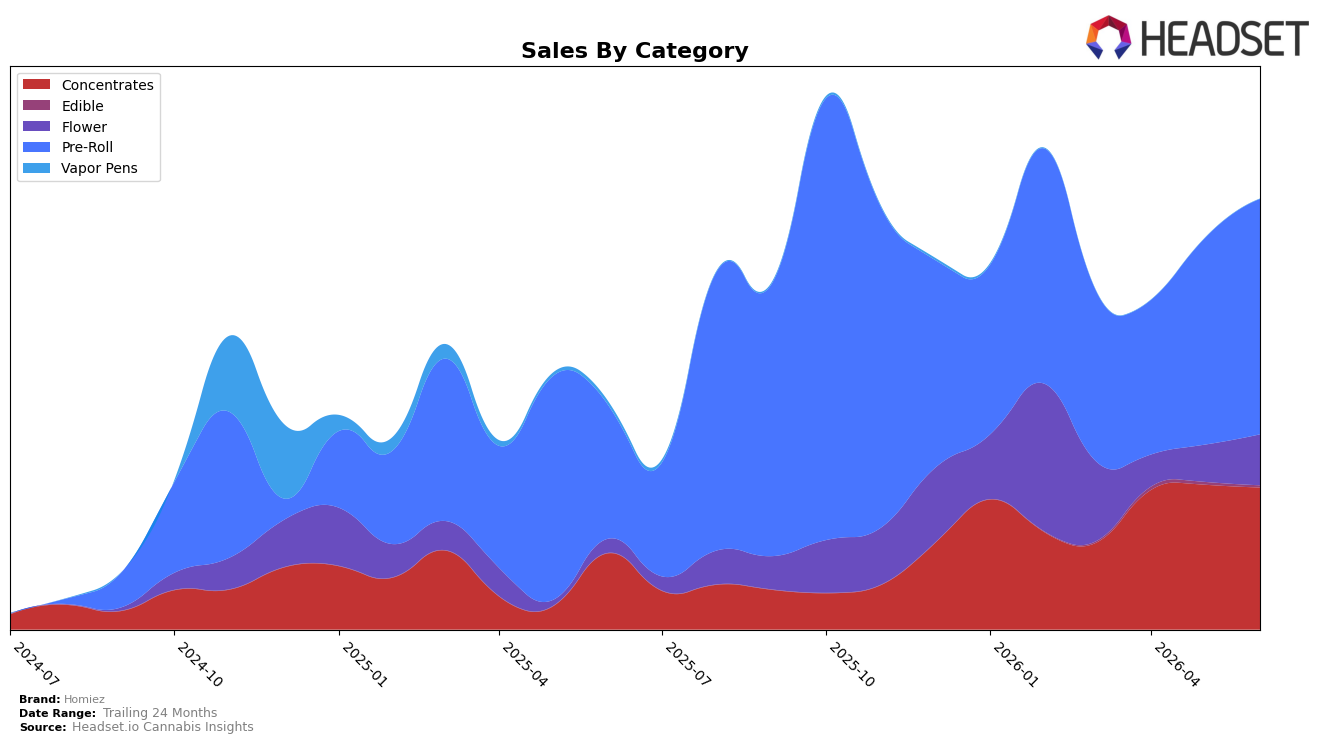
In June 2026, Homiez concentrated 54.77% of sales in Pre-Roll with year-over-year growth of 76.54% and month-over-month expansion of 14.10%, while Concentrates held 33.03% share with 86.61% YoY but slipped 1.95% MoM; Flower climbed to 11.77% share on 267.85% YoY and 37.28% MoM, as Edible contracted to 0.42% share with a 24.76% MoM decline. The brand’s average price fell 4.42% YoY to $13.72 alongside Pre-Roll pricing at 16.03 and Concentrates at 9.86, and the Michigan Pre-Roll rank sat at 49, indicating that the mix is broadening toward Flower while Pre-Roll still anchors scale.
The pattern implies a trade-up into higher-ticket formats without abandoning volume drivers: Flower’s 37.28% MoM surge and 267.85% YoY, paired with a 4.42% YoY price decrease overall, suggests unit velocity gains are funding entry into Flower while Pre-Roll maintains reach at rank 49 in Michigan. With Concentrates down 1.95% MoM despite 86.61% YoY, Homiez is likely redistributing promotional intensity toward Pre-Roll and Flower to secure shelf breadth, meaning near-term positioning hinges on defending a 54.77% Pre-Roll share while nurturing the 11.77% Flower foothold to diversify rank exposure beyond a single category.
Competitive Landscape
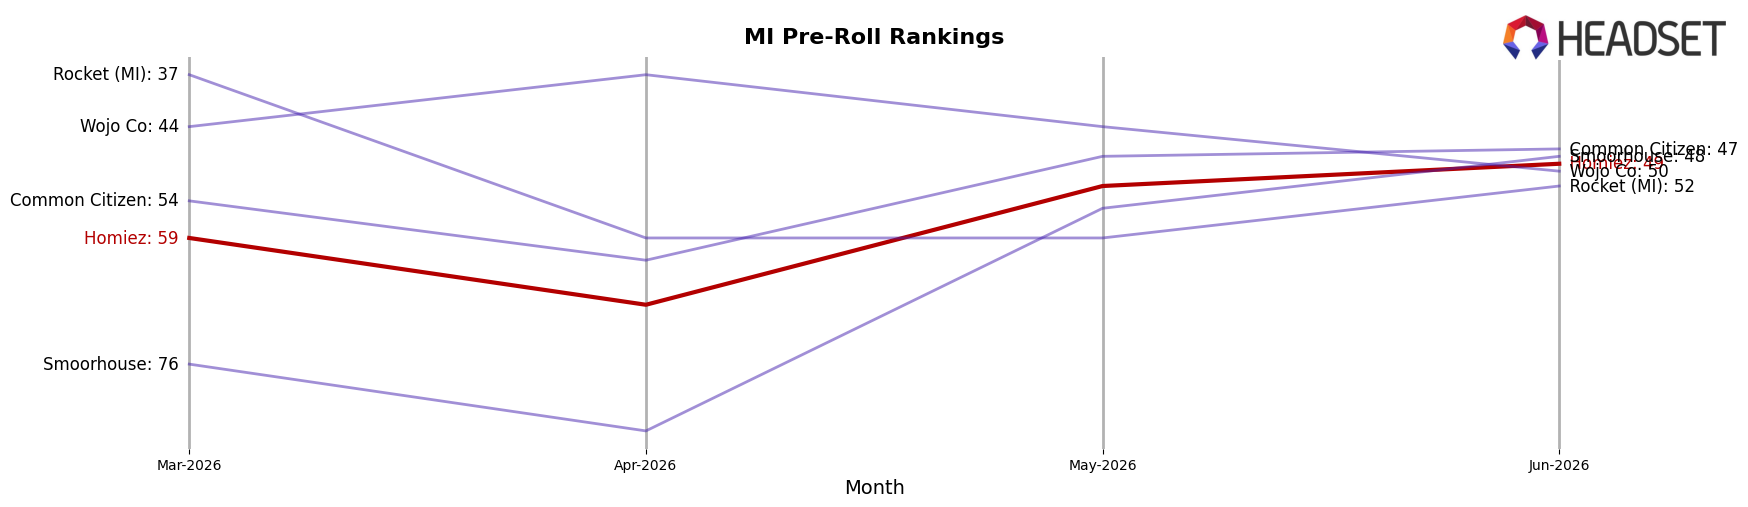
Homiez sits at rank #49 in MI Pre-Roll in June 2026, improving 15 positions from #64 year over year, and gaining 10 spots from #59 since March 2026; however, the brand remains well below its peak of #20 reached in October 2025, a 29-place slide from that high. Meanwhile, Jeeter held steady at #1 year over year while recording a 7.9% sales decline, and Mitten Extracts advanced from #8 to #4 alongside a 114.4% sales increase, indicating that category share is consolidating around faster risers even as some leaders contract. The mix of Homiez’s gradual rank recovery and competitors’ divergent trajectories implies that sustaining gains will require converting short-term momentum into durable share wins before the window created by leader contraction narrows.
Notable Products
Lulu Lemonade Live Resin (1g) posted the standout movement in June 2026 with a +115.8% MoM surge to rank 3, while Peaches & Cream Live Resin (1g) fell -46.3% to rank 10, signaling a sharp divergence within the same concentrates tier. Detroit Runtz Pre-Roll (1g) climbed +74.3% to rank 4 as Candyland Infused Pre-Roll 14-Pack (14g) advanced +45.8% at rank 7, and four of the top ten are Pre-Roll SKUs, indicating mix gravity is tilting toward ready-to-consume formats. Despite Super Lemon Haze Pre-Roll (1g) and Blue Dream Pre-Roll (1g) holding ranks 1 and 2 with no reported MoM rates, the lone high-dollar outlier is Candyland Infused Pre-Roll 14-Pack (14g) at $43,734, contrasting with declining single-gram concentrates like Blueberry Yum Yum Live Resin (1g) at -20.9% and Grape Soda Live Resin (1g) at -5.8%. The pattern implies Homiez is consolidating around pre-roll dominance with selective concentrates breakouts, pointing commercial focus toward scaled multi-pack pre-rolls while rationalizing underperforming live resin variants.
Top Selling Cannabis Brands
Data for this report comes from real-time sales reporting by participating cannabis retailers via their point-of-sale systems, which are linked up with Headset’s business intelligence software. Headset’s data is very reliable, as it comes digitally direct from our partner retailers. However, the potential does exist for misreporting in the instance of duplicates, incorrectly classified products, inaccurate entry of products into point-of-sale systems, or even simple human error at the point of purchase. Thus, there is a slight margin of error to consider. Brands listed on this page are ranked in the top twenty within the market and product category by total retail sales volume.

