Jun-2026
Sales
Trend
6-Month
Product Count
SKUs
Avg Price
YoY Sales Change
YoY Price Change
Market Insights Snapshot
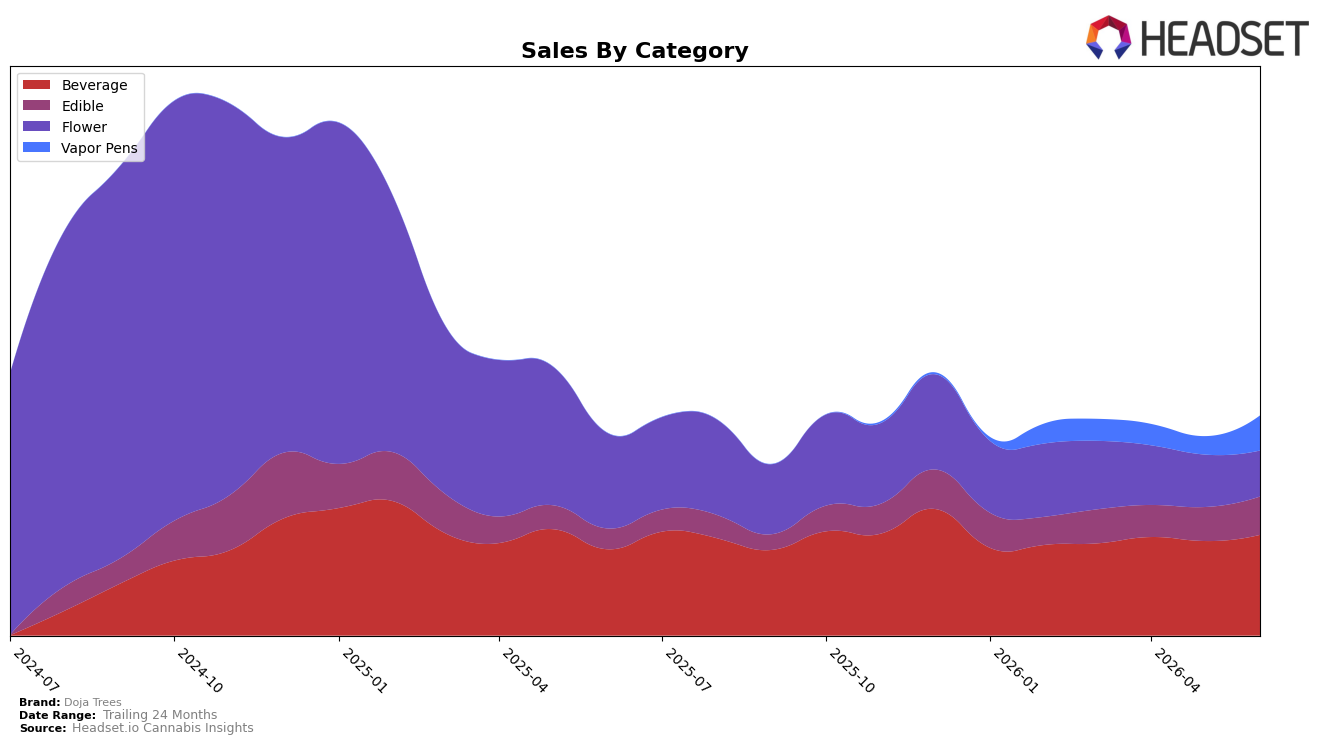
In June 2026, Doja Trees concentrated 45.92% of sales in Beverage with year-over-year growth of 16.79% and month-over-month growth of 6.52%, while Edible expanded to 17.35% share with an 85.94% YoY surge and 12.99% MoM lift. Flower contracted to 20.85% share amid a 51.87% YoY decline and a 12.47% MoM drop, as Vapor Pens climbed to 15.88% share on a 92.70% MoM spike despite no YoY baseline. The brand’s average price fell 26.06% YoY to $6.41, and overall brand sales advanced 8.73% YoY, implying mix shift toward lower-price-per-unit formats that offset Flower attrition with Beverage and Edible volume.
This mix reweighting implies a pivot toward accessible, repeatable consumption occasions anchored in Beverage’s 45.92% share and Edible’s 17.35% share, while the 92.70% MoM acceleration in Vapor Pens signals a trial-led entry that can diversify away from the 51.87% YoY Flower drag. With rank 14 in Beverage in Washington and MoM gains of 6.52% in Beverage alongside 12.99% in Edible, the brand is better positioned to accumulate share in sessionable categories where price elasticity—evidenced by the 26.06% YoY average price reduction—can translate into sustained velocity.
Competitive Landscape
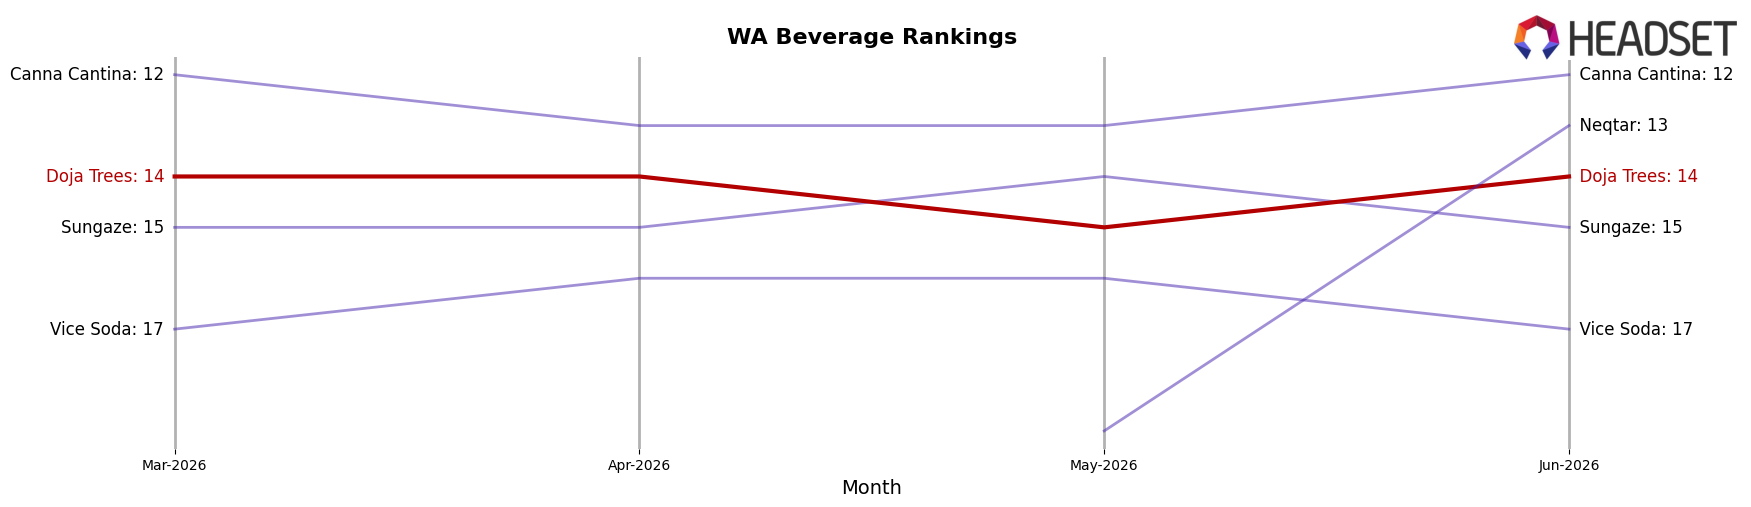
Doja Trees sits at #14 in June 2026, slipping 1 position year over year from #13 while holding flat versus March 2026 at #14, which contrasts with Journeyman edging up from #2 to #1 and Ray's Lemonade falling from #1 to #2 with a 30.3% YoY sales decline. Against middle‑tier movers, Blaze Soda advanced from #8 to #5 alongside a 65.7% YoY sales increase, while Major held at #3 despite a 21.0% YoY sales contraction, indicating that rank stability without growth catalysts can coexist with both rising and shrinking peers. With a prior peak of #10 in February 2025 and no rank gains across the last three months, the trajectory implies Doja Trees is treading water in a polarized ladder where upward mobility likely requires a mix shift or pricing action rather than baseline continuity.
Notable Products
Grape God Shot (100mg, 1.7oz, 50ml) posted the steepest decline at -6.6% while sliding to rank 3, as Blue Raspberry Shot (100mg, 1.7oz, 50ml) held rank 1 with a -2.4% dip, suggesting top-heavy demand is softening at the very peak even as mid-pack beverages accelerate. Lemon Haze Shot (100mg, 1.7oz, 50ml) jumped +26.9% to rank 4 and Green Apple Shot (100mg, 1.7oz, 50ml) surged +32.3% to rank 5, and six of the top ten are Beverage SKUs, implying flavor rotation within shots is capturing wallet share. Watermelon Punch Gummies 10-Pack (100mg) advanced +30.0% to rank 8 while Kush Berry Gummies 10-Pack (100mg) was flat at +0.7% in rank 7, with total gummies penetration still capped behind beverages despite Blue Raspberry Gummies 10-Pack (100mg) entering the top ten with $2,022 in June 2026. The pattern implies Doja Trees is consolidating around beverage-led growth with selective gummy momentum, pointing to a strategy that leans into expanding mid-tier shot flavors while stabilizing flagship variants.
Top Selling Cannabis Brands
Data for this report comes from real-time sales reporting by participating cannabis retailers via their point-of-sale systems, which are linked up with Headset’s business intelligence software. Headset’s data is very reliable, as it comes digitally direct from our partner retailers. However, the potential does exist for misreporting in the instance of duplicates, incorrectly classified products, inaccurate entry of products into point-of-sale systems, or even simple human error at the point of purchase. Thus, there is a slight margin of error to consider. Brands listed on this page are ranked in the top twenty within the market and product category by total retail sales volume.

