.svg)

Sep-2026
Sales
Trend
6-Month
Product Count
SKUs
Avg Price
YoY Sales Change
YoY Price Change


Market Insights Snapshot
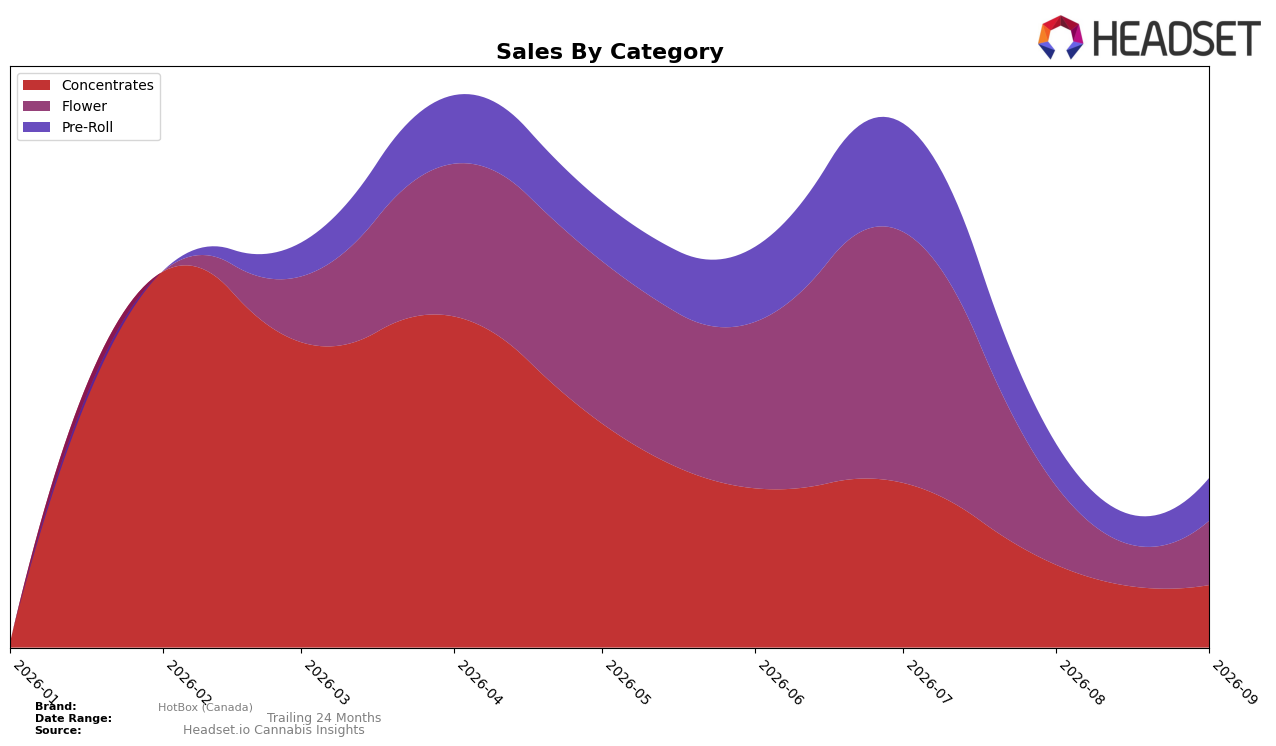
HotBox (Canada)'s mix in September 2026 concentrated in Flower at 37.98% share and Concentrates at 36.84% share, with Pre-Roll at 25.18% share; month over month, Flower declined 18.05% and Concentrates fell 24.42% while Pre-Roll grew 1.52%. With Concentrates ranked 47 in Ontario, the simultaneous pullback in two higher-priced baskets (Flower average price $72.11, Concentrates average price $32.04) alongside a modest Pre-Roll uptick indicates mix rebalancing toward lower-ticket, higher-velocity units, implying volume defense rather than premium expansion.
The 24.42% month-over-month drop in Concentrates versus the 18.05% decline in Flower, coupled with Pre-Roll’s 1.52% growth and a brand-wide average price of $30.21, suggests price-sensitive demand is gaining weight while specialist categories underperform. Given a 47 rank in Concentrates in Ontario and a 25.18% share in Pre-Roll, the brand’s positioning is drifting toward value-led convenience formats over extraction-led niches, implying that near-term share stability likely depends on sustaining Pre-Roll momentum and limiting further mix erosion in Concentrates.
Competitive Landscape
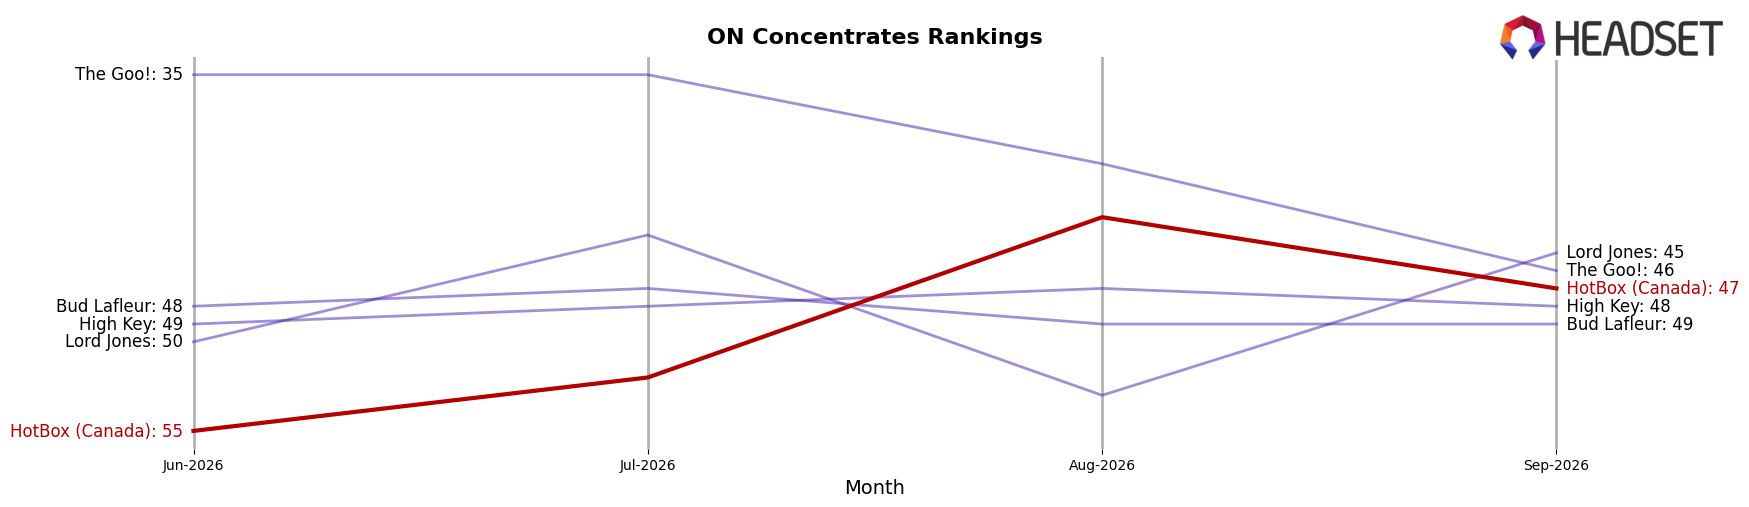
HotBox (Canada) sits at rank #47 in ON Concentrates for September 2026, improving 8 positions from #55 in June 2026, while year-over-year rank data is unavailable but context shows a retreat from a peak rank of #29 in February 2026. Competitive pressure is concentrated at the top: Vortex Cannabis Inc. holds #1 despite a -13.0% YoY sales change, Pura Vida is #2 with a +37.2% YoY increase, and BoxHot advanced to #5 with +52.3% YoY growth; by contrast, Endgame at #4 is down -37.9% YoY, indicating volatility that favors brands capturing share from contractions as well as expansions. The mix of double-digit declines at #1 and #4 alongside double-digit gains at #2 and #5 implies a bifurcating demand pocket where HotBox (Canada)’s recent 8-rank climb signals potential to capitalize on churn at the top rather than chase broad category growth.
Notable Products
F1 Durb Pre-Roll (1g) led the downturn with a -20.5% MoM slide to rank 5 in September 2026, while Grease Monkey Traditional Hash (2g) dropped -38.0% at rank 6, implying pressure on legacy value formats even as Chemdawg Live Resin Infused Pre-Roll (1g) climbed 30.5% to rank 1. High Score (14g) posted the only >50% MoM gain at +51.4% to rank 2, paired with Grease Monkey Pre-Roll (1g) up 41.8% at rank 4, suggesting a barbell between upsized Flower and higher-potency infused Pre-Rolls; five of the top ten are Pre-Roll SKUs, concentrating mix risk in a single category. OG Kush Live Resin Infused Pre-Roll 3-Pack (1.5g) fell -15.9% at rank 8 while House OG Gas Series Live Resin (1g) entered the top 10 at rank 9 with $2,790, indicating shifting demand from traditional hash toward live resin formats within Concentrates. The pattern points to HotBox (Canada) leaning into infused Pre-Rolls and larger-pack Flower to capture velocity, while pruning weaker Pre-Rolls and aging hash SKUs to reduce volatility.
Top Selling Cannabis Brands






Data for this report comes from real-time sales reporting by participating cannabis retailers via their point-of-sale systems, which are linked up with Headset’s business intelligence software. Headset’s data is very reliable, as it comes digitally direct from our partner retailers. However, the potential does exist for misreporting in the instance of duplicates, incorrectly classified products, inaccurate entry of products into point-of-sale systems, or even simple human error at the point of purchase. Thus, there is a slight margin of error to consider. Brands listed on this page are ranked in the top twenty within the market and product category by total retail sales volume.

