Jun-2026
Sales
Trend
6-Month
Product Count
SKUs
Avg Price
YoY Sales Change
YoY Price Change
Market Insights Snapshot
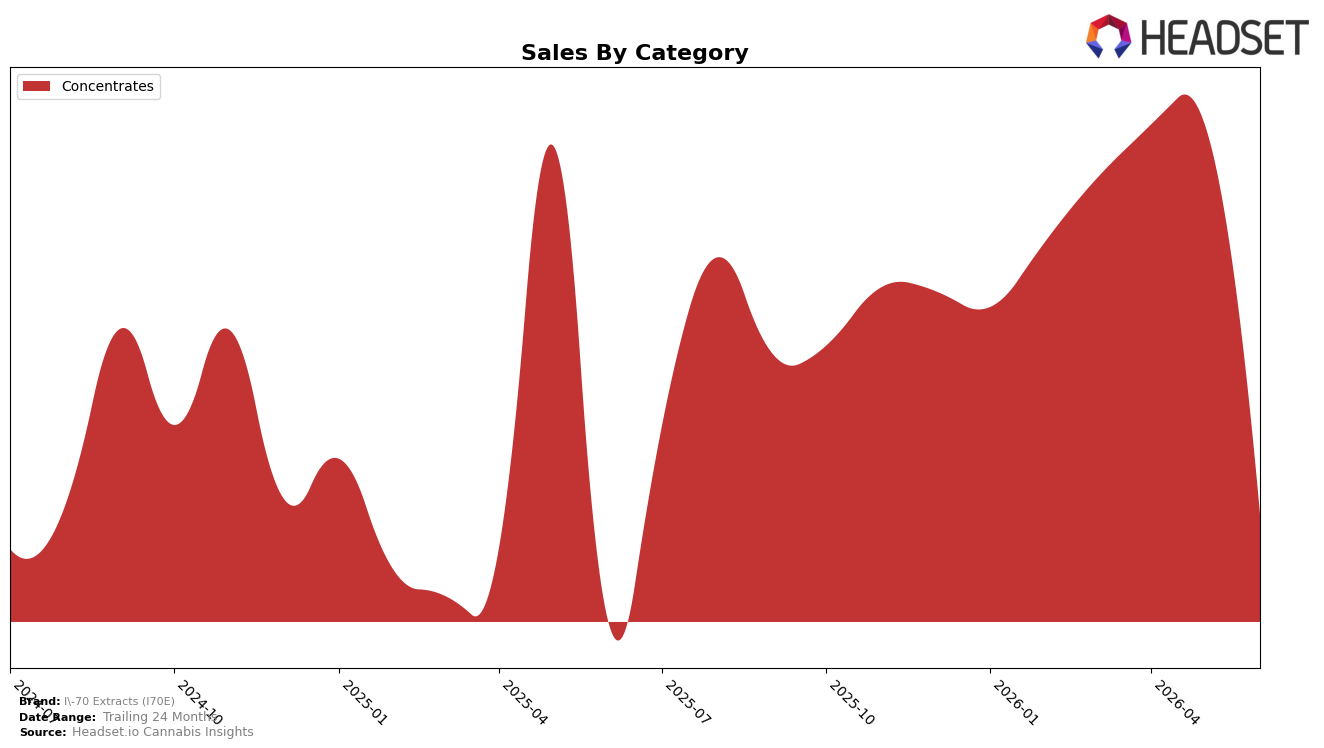
I-70 Extracts (I70E) operated as a single-category brand in June 2026, with Concentrates holding 100.0% of sales share and posting a 54.1% year-over-year increase alongside a 56.1% month-over-month decline. Within Colorado Concentrates, the brand held rank 26, a position that contrasts the 54.1% YoY growth with a sharp MoM pullback of 56.1%, while average price rose 41.0% YoY to $13.10. The pattern implies a pricing-led YoY gain concentrated entirely in Concentrates, but a June reset in velocity likely compressed unit throughput despite the higher price point.
The mix concentration at 100.0% in Concentrates coupled with rank 26 in Colorado suggests exposure to category cyclicality: a 56.1% MoM downswing paired with a 41.0% YoY price increase can widen volatility when no secondary category offsets demand shocks. This positioning implies that sustaining the 54.1% YoY sales lift will depend on stabilizing repeat purchase at the $13.10 average price or adding a second category to buffer MoM swings, because a single-category footprint magnifies rank sensitivity around inventory and promo cadence.
Competitive Landscape
I-70 Extracts (I70E) sits at rank 26 in CO Concentrates for June 2026, improving 11 positions from rank 37 year over year, but slipping 11 spots from rank 15 in March 2026 after peaking at rank 14 in May 2026. Against the leaders, Amber holds rank 1 with a 39.0% year-over-year sales increase while 710 Labs remains rank 2 with a -9.9% year-over-year decline, indicating I-70 Extracts (I70E) moved up the long tail even as the top tier diverged. The juxtaposition of a May 2026 peak at rank 14 followed by a June 2026 drop to rank 26, alongside competitors moving in opposite sales directions, implies a volatility-prone ascent where sustaining mid-tier share will depend on stabilizing post-peak pullbacks rather than sporadic spikes.

Notable Products
With no month-over-month percentages reported for June 2026, the headline is concentration: all top 10 SKUs are Concentrates and four of the top ten are 4g packs, signaling a tilt toward value-size formats. Jetfuel Gelato Sugar Wax (4g) sits at rank 3 while Marsh-Mellow Sugar Wax (4g) holds rank 6, and Maple Syrup Wax (4g) is rank 9, placing multiple multi-gram options within the top 10 and concentrating share away from single grams. Dulce Syrup Wax (1g) at rank 1 versus Stardawg Sugar Wax (1g) at rank 2, alongside Headbanger Sherbet Sugar Wax (1g) at rank 5, shows 1g leaders still anchor the top five even as 4g formats capture three positions between ranks 3 and 9. The mix implies I-70 Extracts (I70E) is leaning into a two-tier pack-size strategy that drives basket trade-up via 4g offerings while preserving trial and velocity with 1g staples.
Top Selling Cannabis Brands
Data for this report comes from real-time sales reporting by participating cannabis retailers via their point-of-sale systems, which are linked up with Headset’s business intelligence software. Headset’s data is very reliable, as it comes digitally direct from our partner retailers. However, the potential does exist for misreporting in the instance of duplicates, incorrectly classified products, inaccurate entry of products into point-of-sale systems, or even simple human error at the point of purchase. Thus, there is a slight margin of error to consider. Brands listed on this page are ranked in the top twenty within the market and product category by total retail sales volume.

