Jun-2026
Sales
Trend
6-Month
Product Count
SKUs
Avg Price
YoY Sales Change
YoY Price Change
Market Insights Snapshot
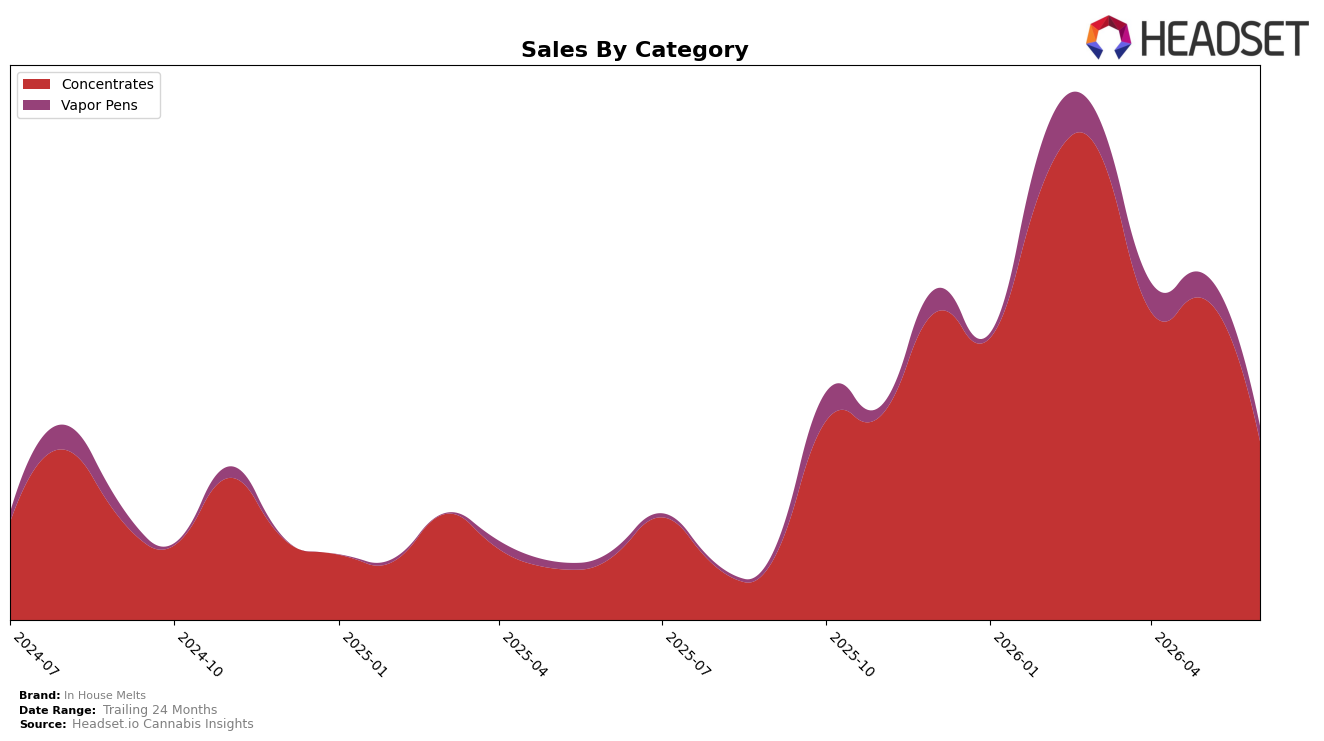
In June 2026, In House Melts concentrated 90.82% of sales in Concentrates while Vapor Pens accounted for 9.18%, a mix that tightened around the core as Concentrates rose 187.29% year over year but fell 43.84% month over month; Vapor Pens also expanded 91.49% year over year yet declined 34.33% month over month. Despite a 7.03% year-over-year drop in average price to $47.66, brand-level sales climbed 174.68% year over year and 98.29% over 24 months, while the Concentrates line sat at rank 20 in Colorado. The pattern implies a demand base that grew markedly versus last year but is cyclically cooling month over month, with price easing cushioning share retention in Concentrates even as short-term velocity softens.
The simultaneous 187.29% year-over-year surge and 43.84% month-over-month pullback in Concentrates, alongside a 91.49% year-over-year lift and 34.33% month-over-month dip in Vapor Pens, indicates that June 2026 mix stability depends on defending repeat usage in Concentrates while preventing Vapor Pens from eroding below its 9.18% share. With rank 20 in Colorado and a 7.03% price reduction year over year, the brand is positioned to convert prior-year trial into baseline volume more efficiently than peers during demand troughs, implying the next gains will come from sustaining wallet share in Concentrates while using targeted price-pack architecture to moderate month-over-month volatility.
Competitive Landscape
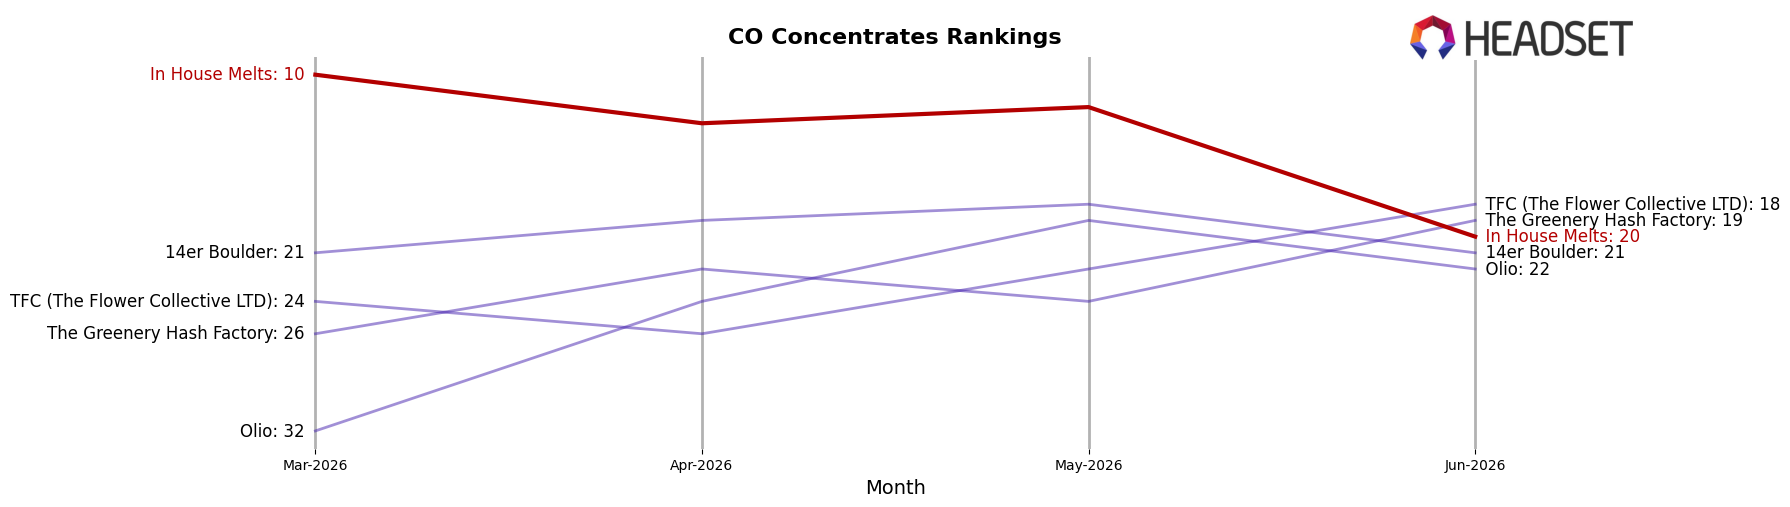
In House Melts sits at rank #20 in CO Concentrates in June 2026, down 21 positions year over year from #41 to #20 and sliding 10 spots since March 2026 when it was #10, after peaking at #9 in February 2026; by contrast, Amber holds #1 with a 39.0% YoY sales increase while 710 Labs remains #2 despite a 9.9% YoY sales decline, indicating that leadership is stable even as mid-tier ranks churn. With a 3-month rank drop from #10 to #20 alongside a YoY rank improvement from #41 to #20, the pattern implies short-term share loss within the middle of the table but a longer-cycle recovery path, suggesting that without a near-term velocity rebound versus top-5 peers, the brand risks further mid-pack erosion.
Notable Products
With no month-over-month percentages available for June 2026, the immediate pattern is concentration rather than movement: Rainbow Push Pop Live Rosin (1g) sits at rank 1 while Drip Drop 90 Micron Cold Cure Live Rosin (1g) holds rank 2, and eight of the top ten are tied at rank 5. The ranks cluster tightly at the top end, with positions 1–5 covering the entire leaderboard and no entries below rank 5, implying a narrow spread of performance where small shifts could reshuffle visibility quickly.
Category concentration is absolute, with 10 of 10 top products in Concentrates, and within that, multiple 90 Micron Cold Cure Live Rosin variants occupy shared rank 5 positions. Honey Limez Cold Cure Live Rosin (2g) at rank 4 stands out as the only 2g format among 1g peers while still priced into a similar sales band at $6,860, indicating format expansion without displacing the 1g core. The pattern implies In House Melts is leaning into a focused Concentrates portfolio where micro-differentiated SKUs share rank space, suggesting a strategy of breadth within a single category to capture varied preferences without diluting top-tier rank presence.
Top Selling Cannabis Brands
Data for this report comes from real-time sales reporting by participating cannabis retailers via their point-of-sale systems, which are linked up with Headset’s business intelligence software. Headset’s data is very reliable, as it comes digitally direct from our partner retailers. However, the potential does exist for misreporting in the instance of duplicates, incorrectly classified products, inaccurate entry of products into point-of-sale systems, or even simple human error at the point of purchase. Thus, there is a slight margin of error to consider. Brands listed on this page are ranked in the top twenty within the market and product category by total retail sales volume.

