.svg)

Sep-2026
Sales
Trend
6-Month
Product Count
SKUs
Avg Price
YoY Sales Change
YoY Price Change


Where to Buy
Invisible Man is stocked at 38 licensed dispensaries across Missouri, with the deepest coverage in Columbia, St. Louis, Kansas City, O'Fallon, and Cape Girardeau. Search by ZIP code or city below to find the closest one, or filter by product type if you are after a specific format.
Market Insights Snapshot
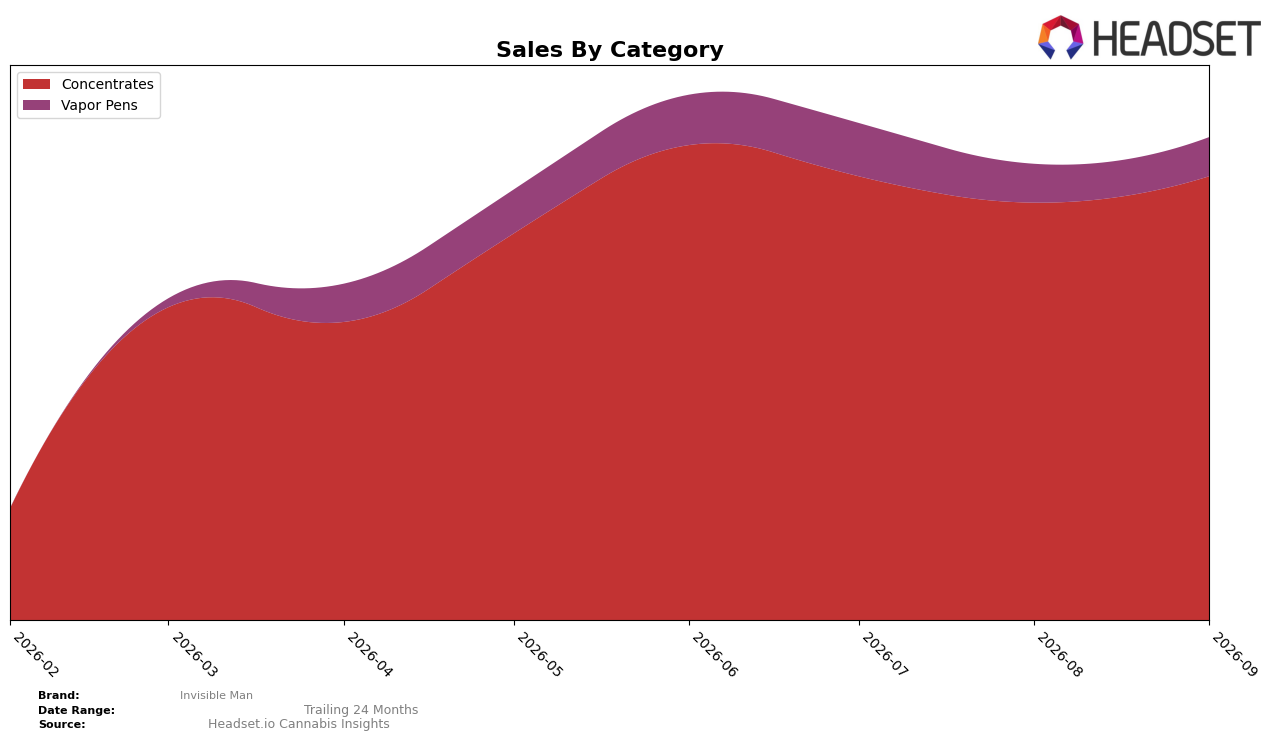
In September 2026, Invisible Man concentrated 91.97% of sales in Concentrates while Vapor Pens accounted for 8.03%, indicating an even tighter tilt toward Concentrates than a balanced mix would suggest. Month over month, Concentrates grew 6.34% compared with 0.84% for Vapor Pens, and the average price in Concentrates at $29.14 sat 12.6% above the brand’s overall $28.85 average while Vapor Pens trailed by 10.3%. With Concentrates holding rank 20 in Missouri and adding share via a faster MoM growth rate than Vapor Pens, the data implies the brand’s near-term volume is being pulled by a single engine rather than a diversified portfolio.
The widening spread between category growth rates (6.34% MoM in Concentrates versus 0.84% in Vapor Pens) and the 12.6% price premium in Concentrates versus a 10.3% discount in Vapor Pens implies pricing power and consumer pull are anchored in Concentrates. Holding rank 20 in Concentrates within Missouri while maintaining only an 8.03% share in Vapor Pens suggests the brand’s positioning is mid-pack where it is strongest and thin elsewhere, which raises concentration risk if category momentum cools. The pattern points to a strategy that prioritizes depth in Concentrates over breadth, with the implication that incremental rank gains will likely come faster by compounding in Concentrates than by trying to lift Vapor Pens from a low base.
Competitive Landscape
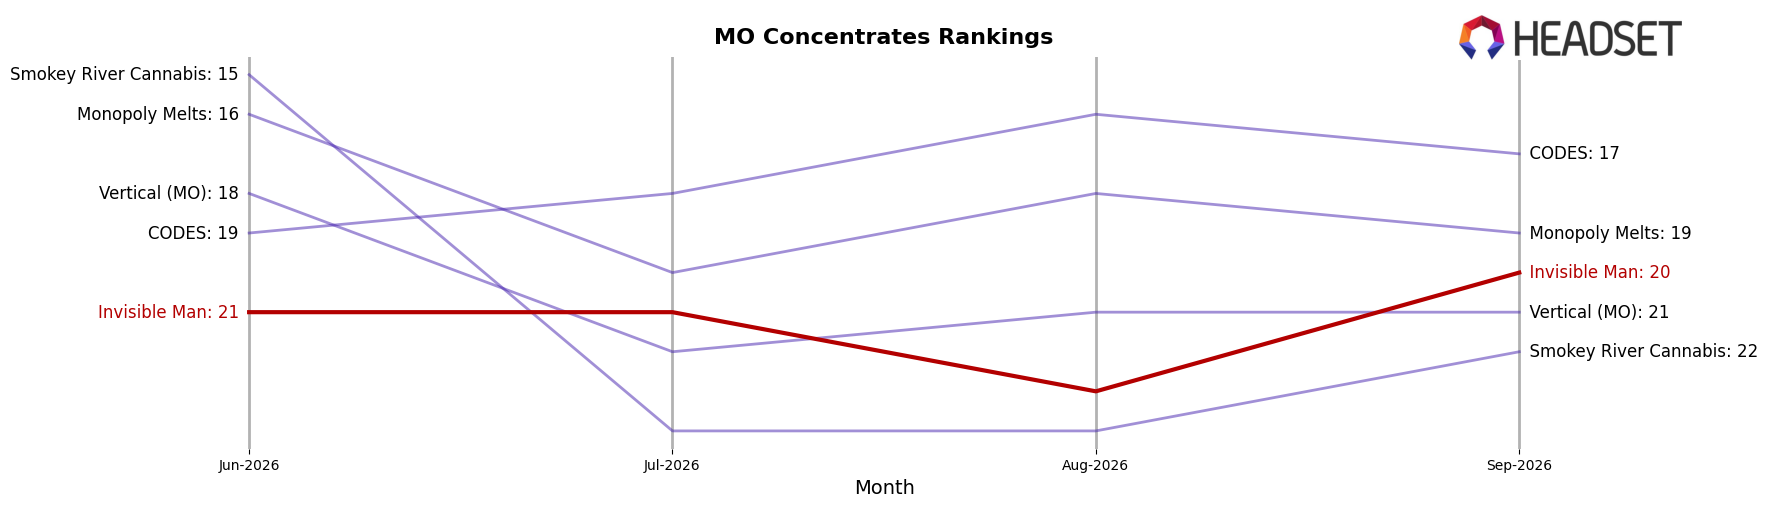
Invisible Man is ranked #20 in MO Concentrates in September 2026, up 1 rank from June 2026, and matching its peak rank of #20 in September 2026; despite the lack of a year-over-year rank, this quarter-on-quarter move contrasts with Vibe Cannabis (MO) holding #1 with a 20.7% YoY sales increase and Elevate sitting at #5 while facing a 41.8% YoY sales decline. Relative placement also tightens against Proper Cannabis, which is #2 after a rank change from #3 year over year and a 23.6% YoY sales increase, while Head Change holds #4 with a 2-position YoY climb but a 13.1% YoY sales contraction; together these splits imply Invisible Man’s incremental rank gain is more about mid-pack volatility than broad market lift, signaling a need to convert small positional wins into sustained share capture.
Notable Products
Purple Punch x Key Lime Jack Cured Badder (1g) delivered the headline move in September 2026 with a 295.6% month-over-month surge to rank 4, while Purple Punch Cured Badder (1g) fell 27.0% to rank 3. Gelato 41 Cured Badder (1g) rose 88.5% and captured rank 1, whereas GG4 Cured Sugar Wax (1g) slipped 9.6% at rank 5. With nine of the top ten SKUs in Concentrates and only one Vapor Pens entry at rank 10, the portfolio is consolidating around badder formats, implying the brand is prioritizing concentrate-led velocity over breadth.
Top Selling Cannabis Brands






Data for this report comes from real-time sales reporting by participating cannabis retailers via their point-of-sale systems, which are linked up with Headset’s business intelligence software. Headset’s data is very reliable, as it comes digitally direct from our partner retailers. However, the potential does exist for misreporting in the instance of duplicates, incorrectly classified products, inaccurate entry of products into point-of-sale systems, or even simple human error at the point of purchase. Thus, there is a slight margin of error to consider. Brands listed on this page are ranked in the top twenty within the market and product category by total retail sales volume.

