.svg)

Sep-2026
Sales
Trend
6-Month
Product Count
SKUs
Avg Price
YoY Sales Change
YoY Price Change


Where to Buy
Dark Horse Cannabis is stocked at 151 licensed dispensaries across Missouri, Arkansas, and 3 other states, 96 of them in Missouri, with the deepest coverage in Kansas City, St. Louis, Cape Girardeau, Independence, and Springfield. Search by ZIP code or city below to find the closest one, or filter by product type if you are after a specific format.
Market Insights Snapshot
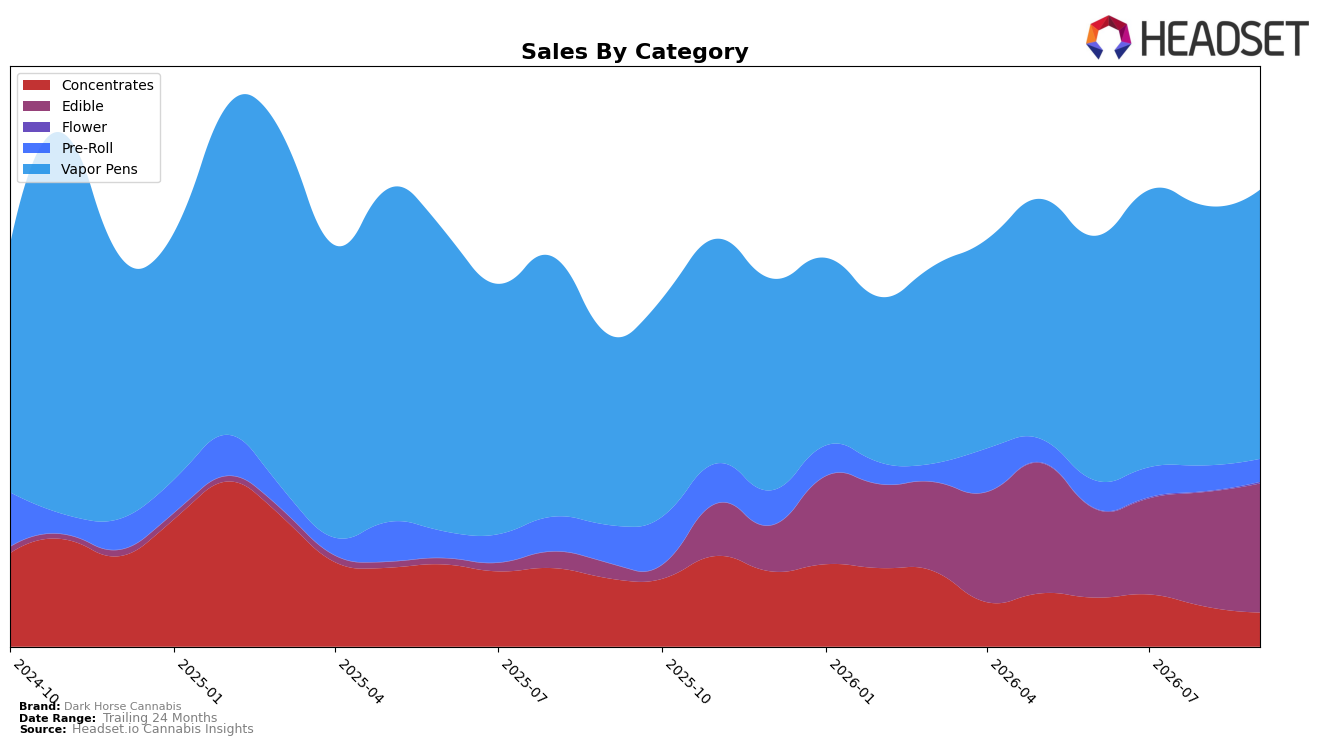
Dark Horse Cannabis concentrated 59.05% of September 2026 sales in Vapor Pens with a 3.55% month-over-month lift and 41.22% year-over-year growth, while Edible expanded to 28.25% share with 12.78% MoM and 766.60% YoY, together signaling a mix pivot toward inhalable-plus-ingestible formats. In contrast, Concentrates fell to 7.45% share with -15.08% MoM and -50.18% YoY, and Pre-Roll slid to 4.98% share with -10.91% MoM and -39.40% YoY, even as Flower—still just 0.27% share—spiked 162.44% MoM; with Vapor Pens ranked 32 in Missouri, the pattern implies share is consolidating into two growth engines while legacy inhalables are being deprioritized at current average pricing of $42.31.
The surge in Edible alongside steady Vapor Pens, paired with price points at $47.86 for pens and $64.85 for edibles versus $10.73 for pre-rolls, indicates a deliberate margin mix despite overall average price rising 2.36% YoY; the -50.18% YoY in Concentrates and -39.40% YoY in Pre-Roll reduce low-ticket volume exposure while supporting higher-ticket categories. Given 46.53% brand sales growth YoY and a Vapor Pens category rank of 32 in Missouri, the shift implies positioning toward premiumized, higher-ASP formats to stabilize revenue density and lessen dependence on discount-driven segments.
Competitive Landscape
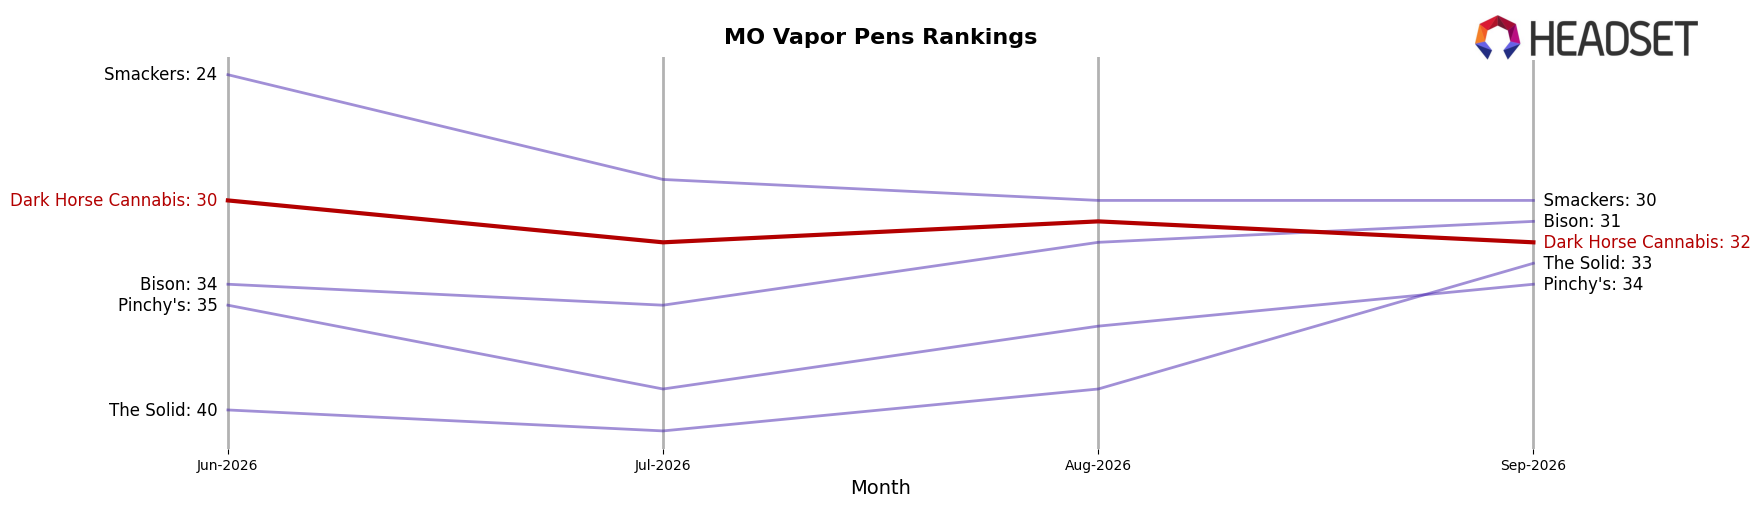
Dark Horse Cannabis sits at rank #32 in MO Vapor Pens in September 2026, up 1 position year over year from #33 but down 2 positions from June 2026’s #30; against this, category leaders moved differently, with Illicit / Illicit Gardens holding #1 with 17.1% YoY sales growth while Rove slid from #3 YoY to #5 on a -4.3% YoY sales change. The brand’s current #32 is 9 places below its peak #23 from November 2024, and the 3-position spread between #29 and #32 across recent months signals limited upward mobility while Good Day Farm climbed from #5 YoY to #3 on 35.4% YoY growth; the pattern implies Dark Horse Cannabis is stabilizing near the lower third of the leaderboard rather than reattaining its prior peak without a share-accretive shift.
Notable Products
Ripstick - Hawaiian Haze Live Resin Distillate Disposable (0.5g) posted the steepest decline at -22.8% while dropping to rank 8, and Granddaddy Purple Live Resin Terps Distillate Cartridge (1g) fell -13.4% at rank 7, indicating erosion in certain legacy vape strains even as Ripstick - Sour Diesel Live Resin Terpene Distillate Disposable (0.5g) rose 38.2% to rank 1. Countering the declines, Hawaiian Haze Live Resin Distillate Cartridge (1g) surged 45.3% at rank 2 and Sour Watermelon Gummies 10-Pack (2000mg) climbed 42.9% to rank 3, with Sweet Watermelon Gummies 10-Pack (2000mg) up 42.2% at rank 4, implying momentum is shifting toward a mix of 1g carts and high-dosage edibles. Seven of the top ten are Vapor Pens while two Edible SKUs sit at ranks 3 and 4, and the category split alongside a single $43,390 edible suggests Dark Horse Cannabis is tilting assortment toward fast-moving carts while letting edibles carry incremental basket expansion.
Top Selling Cannabis Brands






Data for this report comes from real-time sales reporting by participating cannabis retailers via their point-of-sale systems, which are linked up with Headset’s business intelligence software. Headset’s data is very reliable, as it comes digitally direct from our partner retailers. However, the potential does exist for misreporting in the instance of duplicates, incorrectly classified products, inaccurate entry of products into point-of-sale systems, or even simple human error at the point of purchase. Thus, there is a slight margin of error to consider. Brands listed on this page are ranked in the top twenty within the market and product category by total retail sales volume.

