.svg)
Sep-2026
Sales
Trend
6-Month
Product Count
SKUs
Avg Price
YoY Sales Change
YoY Price Change


Market Insights Snapshot
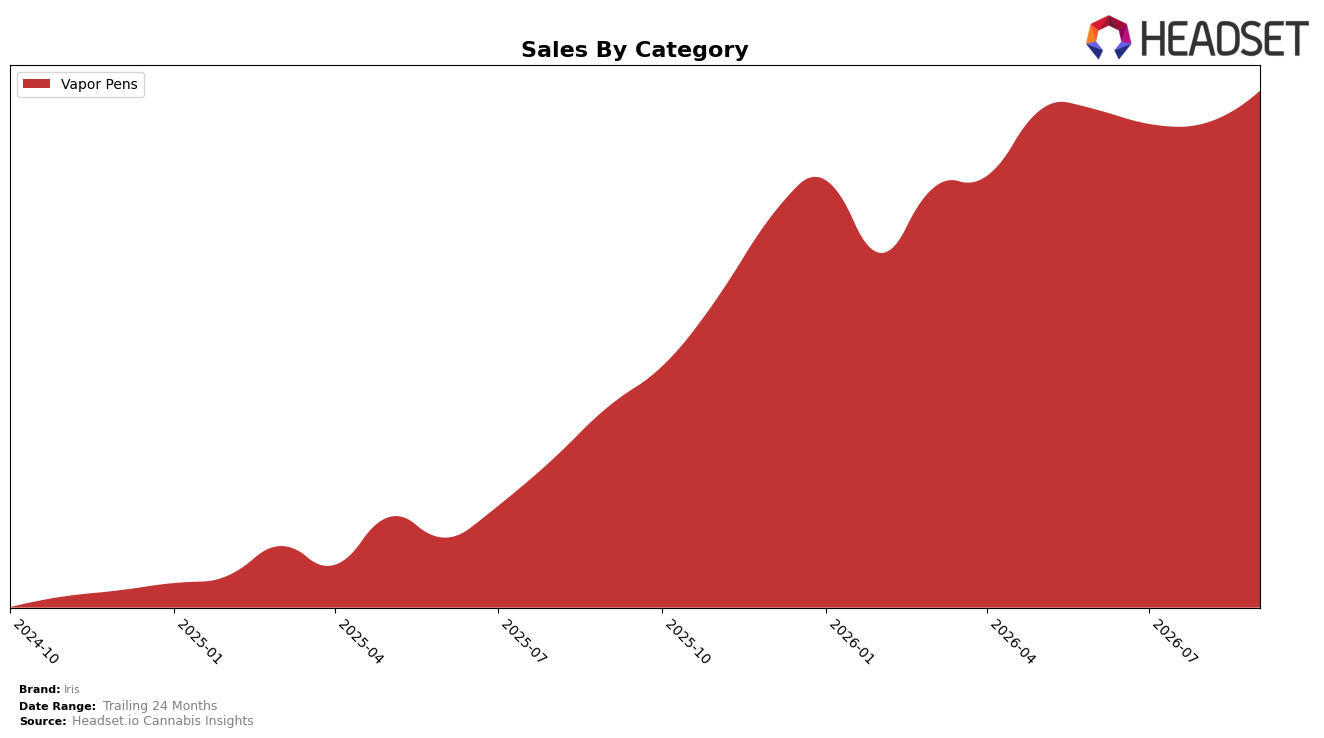
In September 2026, Iris concentrated 100.0% of sales in Vapor Pens, with category sales up 140.99% year over year and 6.42% month over month, while average price edged up 1.47% YoY to $41.31. Within Ontario Vapor Pens, the brand held rank 13, indicating room between current placement and the top 10 as category share consolidation coincides with double‑digit MoM momentum; the pattern implies Iris is leaning into a single‑category scale play rather than diversifying across adjacent formats.
The single‑category focus paired with a 6.42% MoM lift and rank 13 standing suggests Iris is trading depth for breadth, prioritizing penetration and repeat within Vapor Pens over cross‑category expansion; the 140.99% YoY surge alongside a modest 1.47% YoY price increase implies unit-led growth rather than price-taking. This configuration implies a positioning anchored in volume capture and mix stability, where incremental gains will likely come from moving up a few rank positions and compounding share within Vapor Pens rather than adding new categories in the near term.
Competitive Landscape
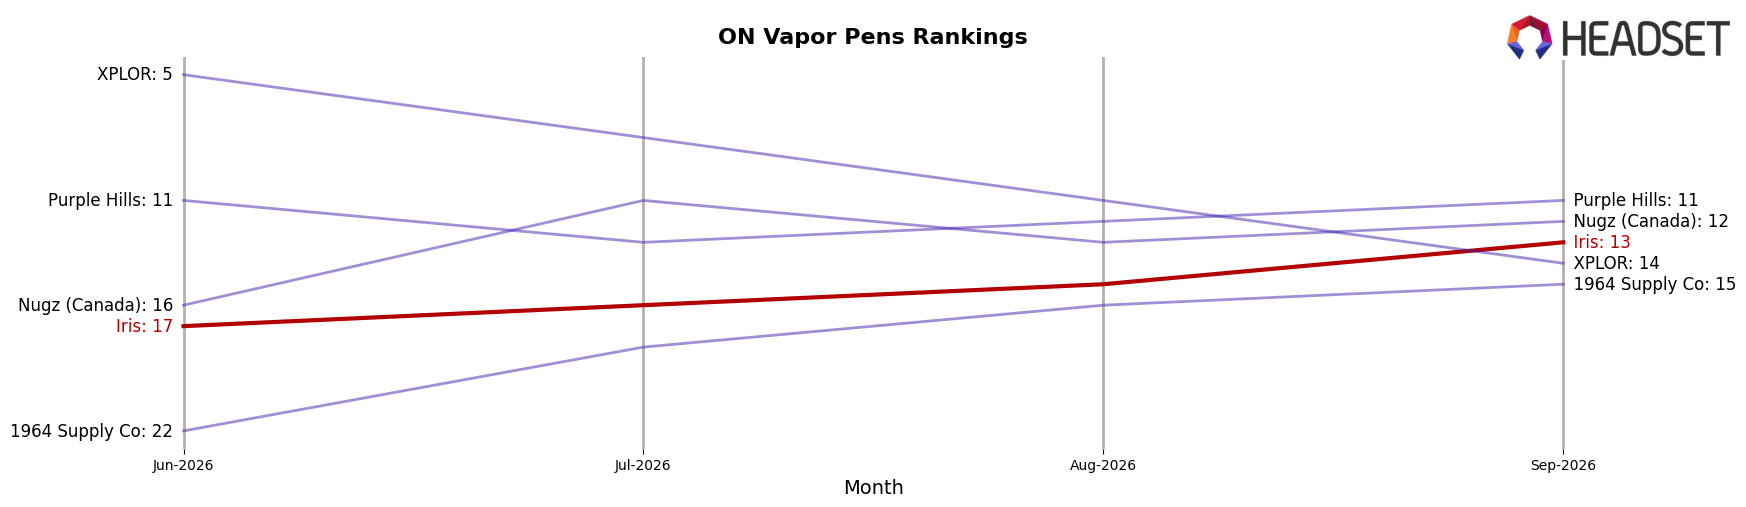
Iris sits at rank 13 in ON Vapor Pens in September 2026, up 17 positions year over year from rank 30, and 4 spots higher than its June 2026 rank of 17, marking a new peak at rank 13 in September 2026; in contrast, Spinach moved from rank 4 to rank 1 with 172.5% YoY sales growth while BoxHot edged from rank 2 to rank 3 with 19.9% YoY growth. Against this backdrop, Kolab jumped from rank 14 to rank 5 with 93.0% YoY growth and General Admission slid from rank 3 to rank 4 with a -12.0% YoY sales change, indicating that Iris’s ascent into the low-teens coincides with accelerated mobility among leaders rather than broad category stagnation; the trajectory implies Iris is transitioning from peripheral to contender status, with further share gains contingent on sustaining momentum against top-five climbers.
Notable Products
Purple Sundaze Live Resin Cartridge (1g) set the tone with a -13.0% month-over-month drop while sliding to rank 3, contrasting with Blackwater Live Resin FSE Cartridge (1g) at rank 1 on +15.6% and Fantasm Live Resin Cartridge (1g) at rank 2 on +10.1%. Four of the top five SKUs are Vapor Pens, concentrating share in a single form factor even as Fantasm Live Resin Disposable (1g) fell -10.4% at rank 5 and Cherry Bang Bang Live Resin Cartridge (1g) dipped -9.0% at rank 4. With Blackwater Live Resin FSE Cartridge (1g) generating $336,738 alongside double-digit growth, the mix implies Iris is leaning into higher-performing Live Resin cartridges while paring back disposable exposure.
Top Selling Cannabis Brands






Data for this report comes from real-time sales reporting by participating cannabis retailers via their point-of-sale systems, which are linked up with Headset’s business intelligence software. Headset’s data is very reliable, as it comes digitally direct from our partner retailers. However, the potential does exist for misreporting in the instance of duplicates, incorrectly classified products, inaccurate entry of products into point-of-sale systems, or even simple human error at the point of purchase. Thus, there is a slight margin of error to consider. Brands listed on this page are ranked in the top twenty within the market and product category by total retail sales volume.

