.svg)
Sep-2026
Sales
Trend
6-Month
Product Count
SKUs
Avg Price
YoY Sales Change
YoY Price Change


Market Insights Snapshot
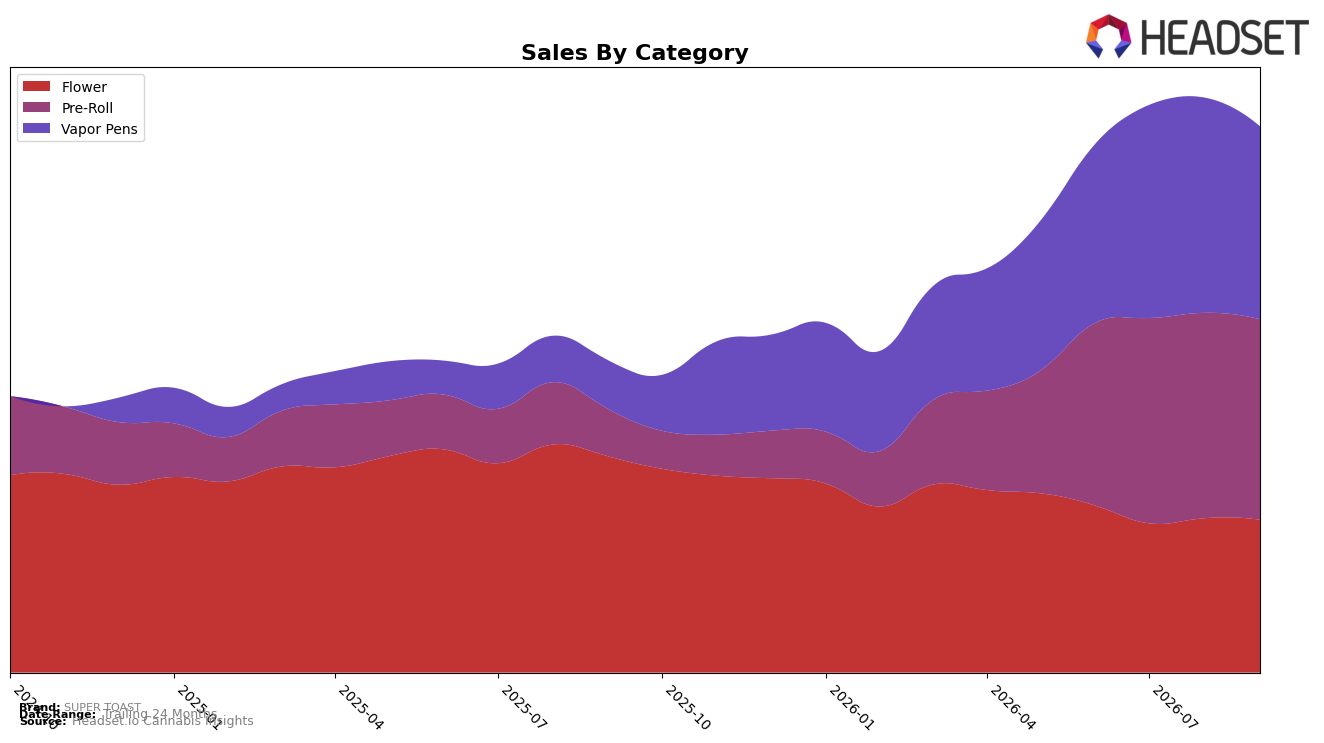
SUPER TOAST shifted its category mix in September 2026 toward Pre-Roll at 36.70% share and Vapor Pens at 35.33% share, while Flower fell to 27.97% share; the month-over-month picture shows Pre-Roll down 2.40% and Vapor Pens down 10.34%, compared with a smaller 0.99% dip in Flower. Year over year, Pre-Roll grew 324.93% and Vapor Pens grew 297.76%, contrasting with a 29.37% decline in Flower, and the brand’s average price declined 1.01% despite overall brand sales growing 75.07% year over year. The pattern implies SUPER TOAST is leaning into higher-velocity inhalable formats for scale while letting Flower recede, with recent month-over-month softness concentrated in Vapor Pens indicating a need to stabilize repeat momentum as mix pivots away from traditional Flower.
Positioning-wise, the mix and rank context suggest SUPER TOAST is competing more on breadth in inhalables than depth in Flower, where it holds rank 9 in Flower in Ontario even as Flower’s sales declined 29.37% year over year and slipped 0.99% month over month. With Pre-Roll’s 36.70% share and Vapor Pens’ 35.33% share both posting triple-digit year-over-year gains (324.93% and 297.76% respectively) alongside a 1.01% drop in average price, the brand is trading some unit margin for volume scale; this implies SUPER TOAST’s near-term edge will come from defending Pre-Roll share while arresting the 10.34% month-over-month contraction in Vapor Pens to avoid over-reliance on a single fast-growing, but volatile, format.
Competitive Landscape
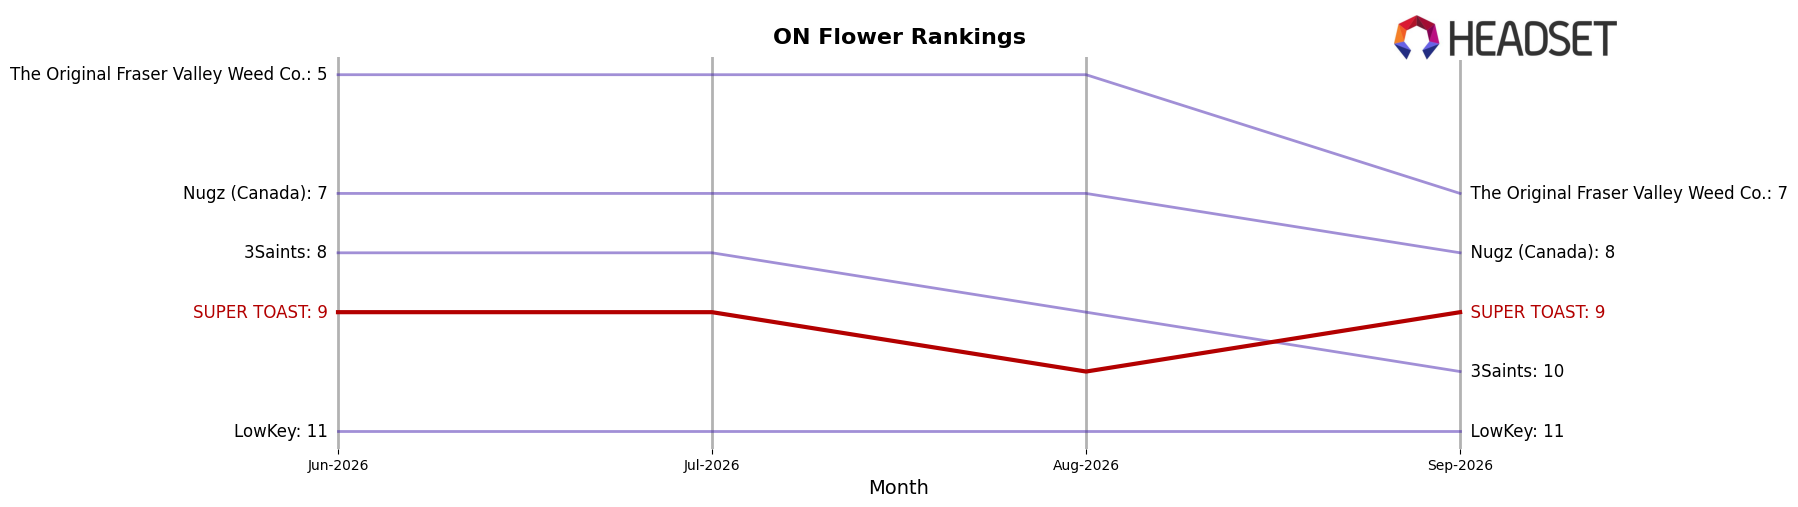
SUPER TOAST sits at #9 in ON Flower in September 2026, down two positions year over year from #7, and flat versus June 2026 at #9, while the brand’s peak of #6 in June 2025 now sits three ranks above its current position; in contrast, Spinach climbed from #3 to #1 with approximately 15.7% YoY sales growth and FIGR rose from #14 to #5 with about 51.7% YoY growth, whereas Back Forty / Back 40 Cannabis slipped from #1 to #3 alongside a 7.4% YoY decline, indicating that SUPER TOAST’s two-rank YoY drop and static three-month position imply a loss of momentum relative to faster-rising rivals and a need to reassert its prior June 2025 peak trajectory.
Notable Products
Sgt. Pineapple Liquid Diamonds Disposable (0.95g) posted the sharpest movement in September 2026 with a -14.6% month-over-month slide while holding rank 9, contrasted with Watermelon Felon Liquid Diamond Cartridge (1g) down -10.3% at rank 5. Hoagies Pre-Roll 2-Pack (2g) in rank 1 grew 6.4% MoM while Liquid Demons - Mix Pack Infused Pre-Roll 5-Pack (2.5g) in rank 3 added 2.2%, and three Pre-Roll SKUs sit in the top ten including a rank-8 entry that fell -10.3%. This split—vape weakness at -10.3% and -14.6% against modest Pre-Roll gains of 2.2% to 6.4%—implies SUPER TOAST’s near-term mix is tilting toward combustion formats over disposables, signaling merchandising and inventory should bias to Pre-Rolls rather than Vapor Pens.
Top Selling Cannabis Brands






Data for this report comes from real-time sales reporting by participating cannabis retailers via their point-of-sale systems, which are linked up with Headset’s business intelligence software. Headset’s data is very reliable, as it comes digitally direct from our partner retailers. However, the potential does exist for misreporting in the instance of duplicates, incorrectly classified products, inaccurate entry of products into point-of-sale systems, or even simple human error at the point of purchase. Thus, there is a slight margin of error to consider. Brands listed on this page are ranked in the top twenty within the market and product category by total retail sales volume.

