.svg)

Sep-2026
Sales
Trend
6-Month
Product Count
SKUs
Avg Price
YoY Sales Change
YoY Price Change


Market Insights Snapshot
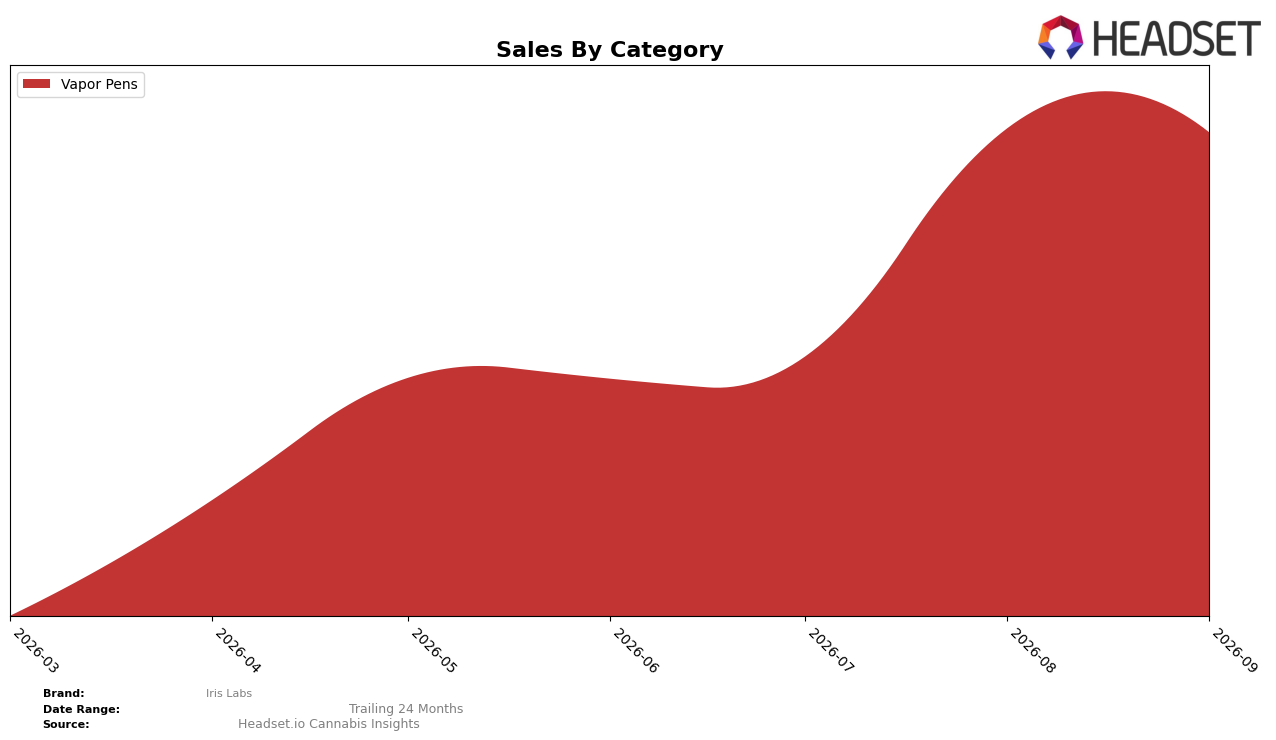
In September 2026, Iris Labs operated as a single-category brand, with Vapor Pens accounting for 100.0% category share and a month-over-month change of -0.56%. The brand’s average price was $40.65, and its Vapor Pens rank in Ontario was 32, placing it outside the top 30 and indicating less shelf visibility relative to higher-ranked peers. With no year-over-year percentage reported and a full concentration in one category, the -0.56% MoM alongside a rank of 32 implies that September 2026 did not deliver mix-driven offsets; the pattern suggests reliance on price and velocity within Vapor Pens rather than diversification or cross-category cushioning.
The unchanged 100.0% mix combined with a -0.56% MoM points to a positioning anchored in Vapor Pens where small volume dips translate directly into brand-level softness, and a rank of 32 in Ontario limits discovery relative to higher-ranked incumbents. At a $40.65 average price against a -0.56% MoM, the trade-off implies a price-to-rank equilibrium that may cap trial elasticity; the concentration and ranking pattern indicate that growth depends more on subsegment coverage within Vapor Pens and retail penetration than on broadening into adjacent categories.
Competitive Landscape
Iris Labs sits at rank #32 in ON Vapor Pens as of September 2026, a climb of 5 positions from #37 in June 2026, with its peak rank of #32 arriving in September 2026; in contrast, Spinach moved up year over year from #4 to #1 while growing sales by 172.5%, and Kolab advanced from #14 to #5 alongside a 93.0% sales increase. Against this backdrop, General Admission slipped from #3 to #4 with a -12.0% sales change, while BoxHot improved from #2 to #3 with a 19.9% gain; Iris Labs’ recent 5-rank quarter-over-quarter rise alongside competitors’ divergent momentum implies a late-2026 foothold that depends on sustaining incremental share wins rather than chasing top-tier velocity immediately.

Notable Products
Cherry Bang Bang Live Resin Cartridge (1g) posted the steepest decline at -18.7% and slipped to rank 2, while Cherry Bang Bang Live Resin FSE Cartridge (1g) fell -10.6% yet held rank 1. Fantasm Live Resin Disposable (1g) rose 40.4% to rank 4, but no SKU cleared a +50% MoM gain, leaving the month defined by contraction at the top and a mid-pack rebound. Four of the top five are Vapor Pens SKUs within two Cherry Bang Bang and two Fantasm line extensions, concentrating share in a narrow format and signaling reliance on a flagship that is cooling as newer disposables test incremental demand.
Top Selling Cannabis Brands






Data for this report comes from real-time sales reporting by participating cannabis retailers via their point-of-sale systems, which are linked up with Headset’s business intelligence software. Headset’s data is very reliable, as it comes digitally direct from our partner retailers. However, the potential does exist for misreporting in the instance of duplicates, incorrectly classified products, inaccurate entry of products into point-of-sale systems, or even simple human error at the point of purchase. Thus, there is a slight margin of error to consider. Brands listed on this page are ranked in the top twenty within the market and product category by total retail sales volume.

