Jun-2026
Sales
Trend
6-Month
Product Count
SKUs
Avg Price
YoY Sales Change
YoY Price Change
Market Insights Snapshot
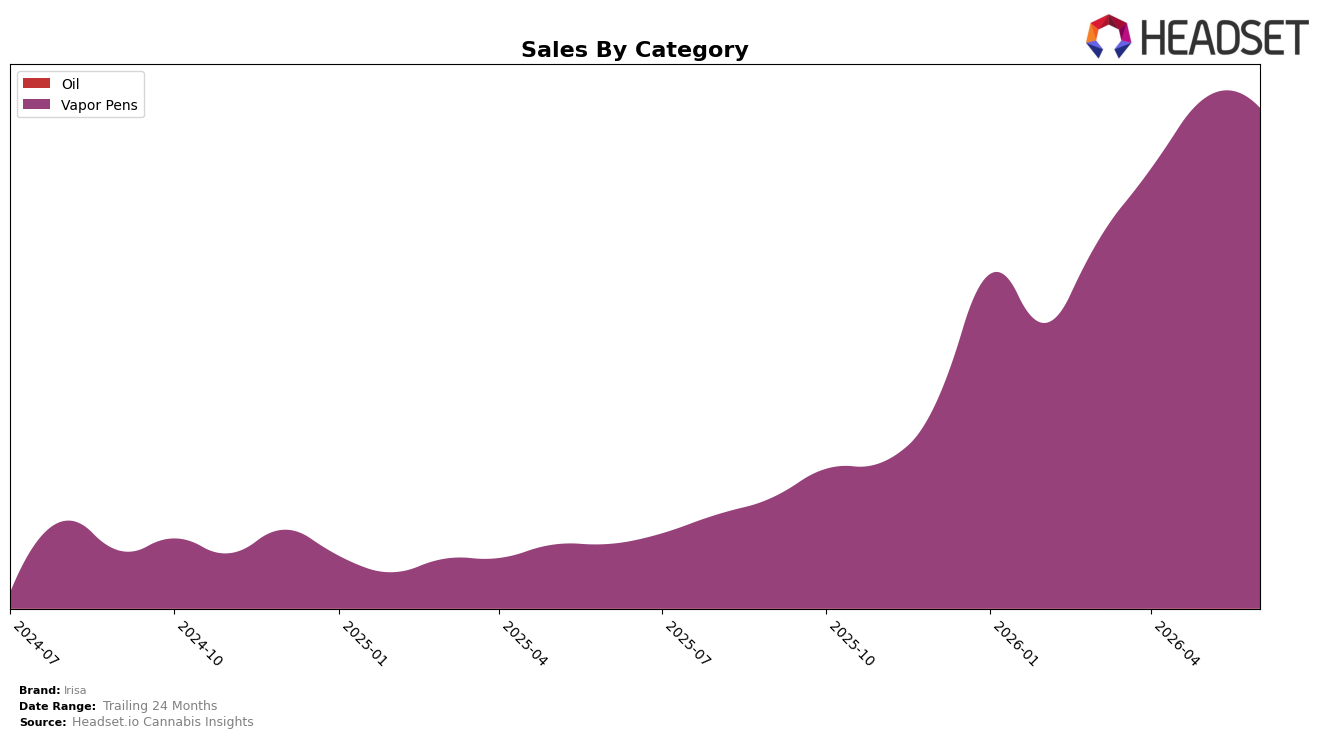
Irisa concentrated entirely in Vapor Pens during June 2026, with the category representing 100.0% mix and ranking 16 in Alberta, while the average price rose 1.63% year over year to $42.27 and category sales slipped 1.83% month over month. Year over year, sales in Vapor Pens expanded 679.67% despite the month-over-month dip, and the single-category focus aligns with Irisa’s top-state concentration in ON, implying scale gains are being driven by a deeper footprint rather than wider category breadth.
The juxtaposition of a 679.67% year-over-year surge with a 1.83% month-over-month pullback, alongside a 1.63% year-over-year price uptick, indicates Irisa’s positioning hinges on maintaining relevance in a single high-velocity format while absorbing short-term volatility typical of Vapor Pens. With the Alberta rank at 16 in Vapor Pens and 100.0% of sales tied to this category, the pattern implies that near-term share outcomes will be more sensitive to execution within Vapor Pens than to pricing levers, and that geographic focus in ON could be leveraged to stabilize monthly swings while preserving year-over-year momentum.
Competitive Landscape
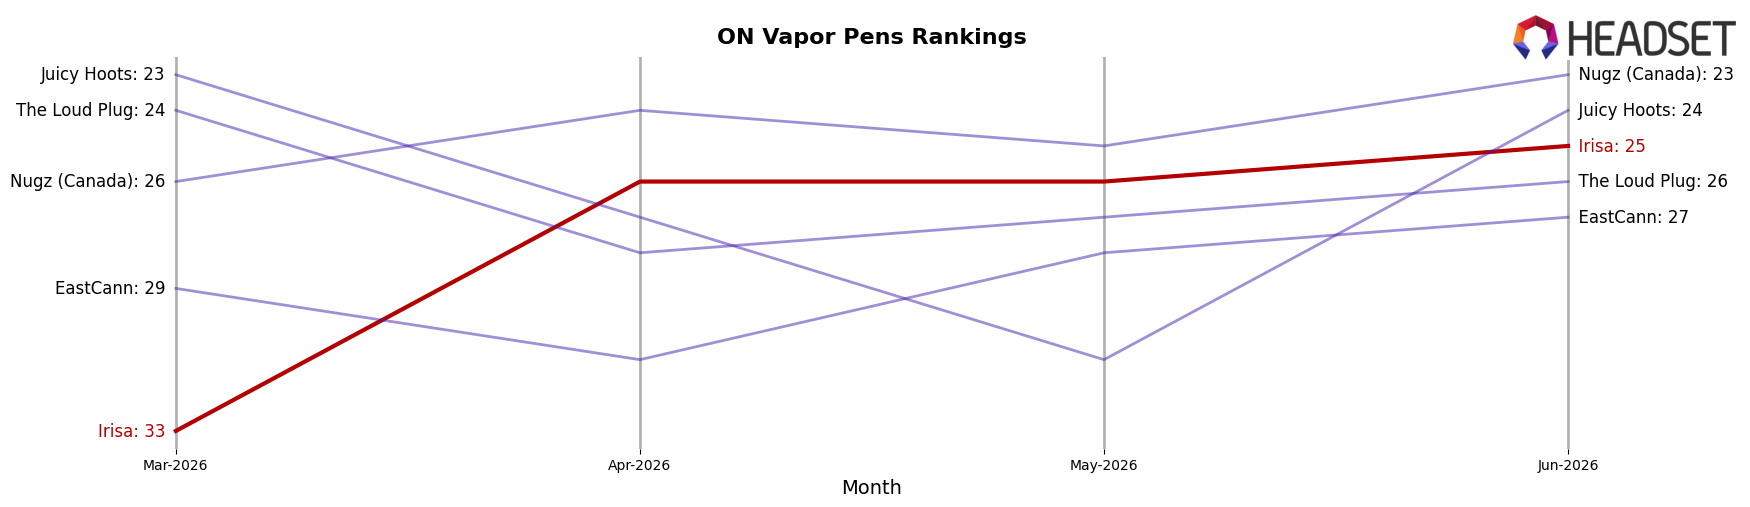
Irisa ranks #25 in ON Vapor Pens in June 2026, up 109 places year over year from #134, and 8 places higher than March 2026’s #33; this jump coincides with a peak-to-date position of #25 in June 2026 and places Irisa outside the top 20 despite reaching a new high. In contrast, Spinach climbed from #5 to #1 with 173.8% year-over-year sales growth, while BoxHot slid from #1 to #3 alongside a 22.1% sales decline, indicating leadership is rotating at the top while Irisa is moving from the long tail toward the mid-pack. The pattern implies Irisa’s rapid rank recovery is driven by relative gains against declining incumbents rather than displacement of the current leaders, suggesting future progress will require converting mid-tier momentum into top-20 penetration.
Notable Products
Blackwater Live Resin Cartridge (1g) posted the steepest decline at -28.1% and slipped to rank 5, while Fantasm Live Resin Cartridge (1g) fell -7.7% at rank 1 and Cherry Bang Bang Live Resin FSE Cartridge (1g) dropped -7.8% at rank 3. Purple Sundaze Live Resin FSE Cartridge (1g) declined -6.2% at rank 2, and four of the top five are Vapor Pens SKUs, indicating category concentration even as month-over-month softness spreads across the lineup. With Fantasm 100% Live Resin Disposable (1g) entering at rank 4 amid unavailable prior-month data and the only cited dollar figure at $273,910 for the leading SKU, the pattern points to volume consolidating in a few pen formats despite short-term pullbacks. The mix implies Irisa is leaning into Vapor Pens dominance while needing fresh variants or formats to offset sequential declines and stabilize share within the category.
Top Selling Cannabis Brands
Data for this report comes from real-time sales reporting by participating cannabis retailers via their point-of-sale systems, which are linked up with Headset’s business intelligence software. Headset’s data is very reliable, as it comes digitally direct from our partner retailers. However, the potential does exist for misreporting in the instance of duplicates, incorrectly classified products, inaccurate entry of products into point-of-sale systems, or even simple human error at the point of purchase. Thus, there is a slight margin of error to consider. Brands listed on this page are ranked in the top twenty within the market and product category by total retail sales volume.

