.svg)

Sep-2026
Sales
Trend
6-Month
Product Count
SKUs
Avg Price
YoY Sales Change
YoY Price Change


Market Insights Snapshot
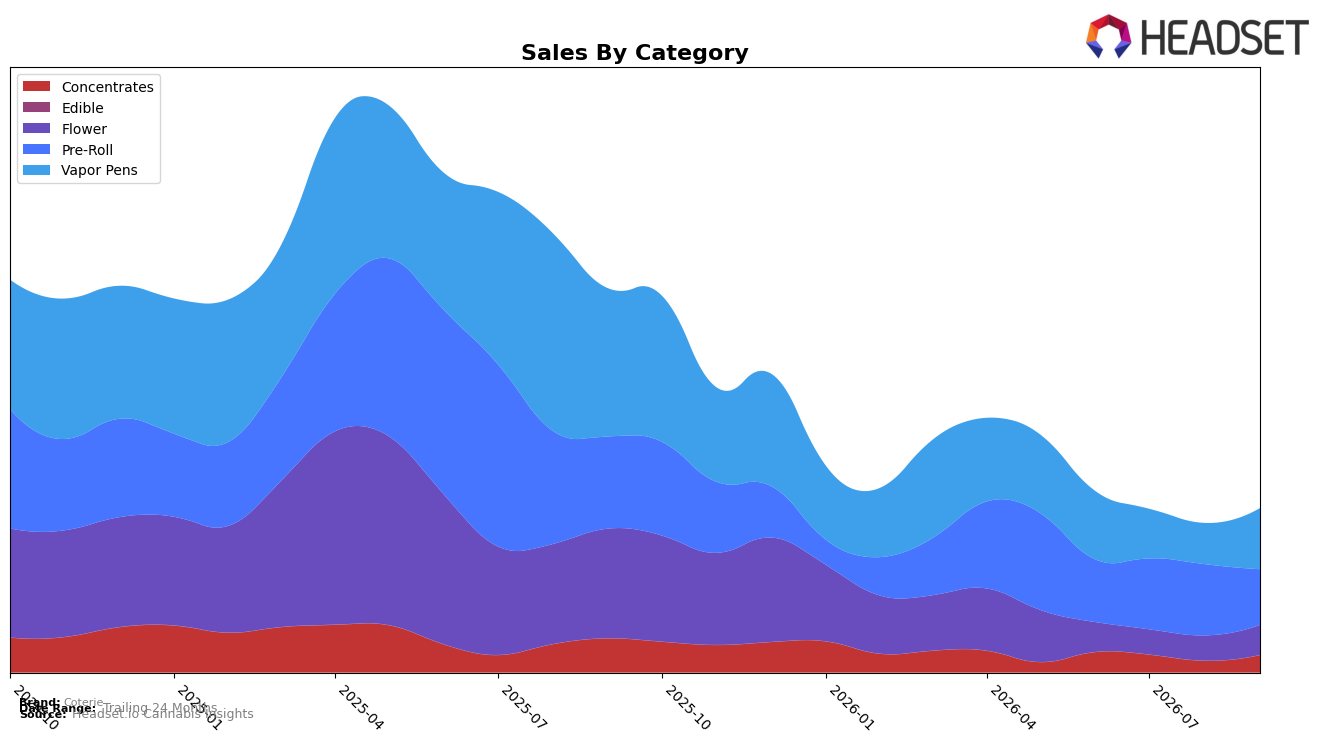
In September 2026, Coterie’s mix was concentrated in Vapor Pens at 37.27% share and Pre-Roll at 33.94% share, with Flower at 18.22% and Concentrates at 10.57%. Vapor Pens rebounded month over month by 48.66% while remaining down 58.79% year over year, and Pre-Roll fell 21.90% month over month while sitting 39.61% lower year over year. Flower grew 19.13% month over month but was down 72.76% year over year, whereas Concentrates climbed 48.94% month over month and was still 49.09% below last year. With an average price down 12.67% year over year and overall brand sales down 57.32% year over year, this pattern implies the brand is leaning on price-accessible recovery in inhalables while digesting a pullback in Pre-Roll mix.
The month-over-month gains in Vapor Pens and Concentrates, paired with a Pre-Roll contraction of 21.90% and a Flower base still 72.76% below last year, suggest a repositioning toward higher-velocity inhalable formats where promo depth or pricing flexibility can move volume. Holding 37.27% share in Vapor Pens while ranking 53 in Vapor Pens in British Columbia indicates room to climb if the 48.66% monthly rebound sustains, but the 39.61% year-over-year decline in Pre-Roll and 12.67% brand-wide price compression imply margin trade-offs. Taken together, the mix shift and rank position imply a defensive tilt toward Vapor Pens-led traffic that could stabilize near-term share at the cost of premium positioning unless pricing and assortment in Flower and Pre-Roll recover.
Competitive Landscape
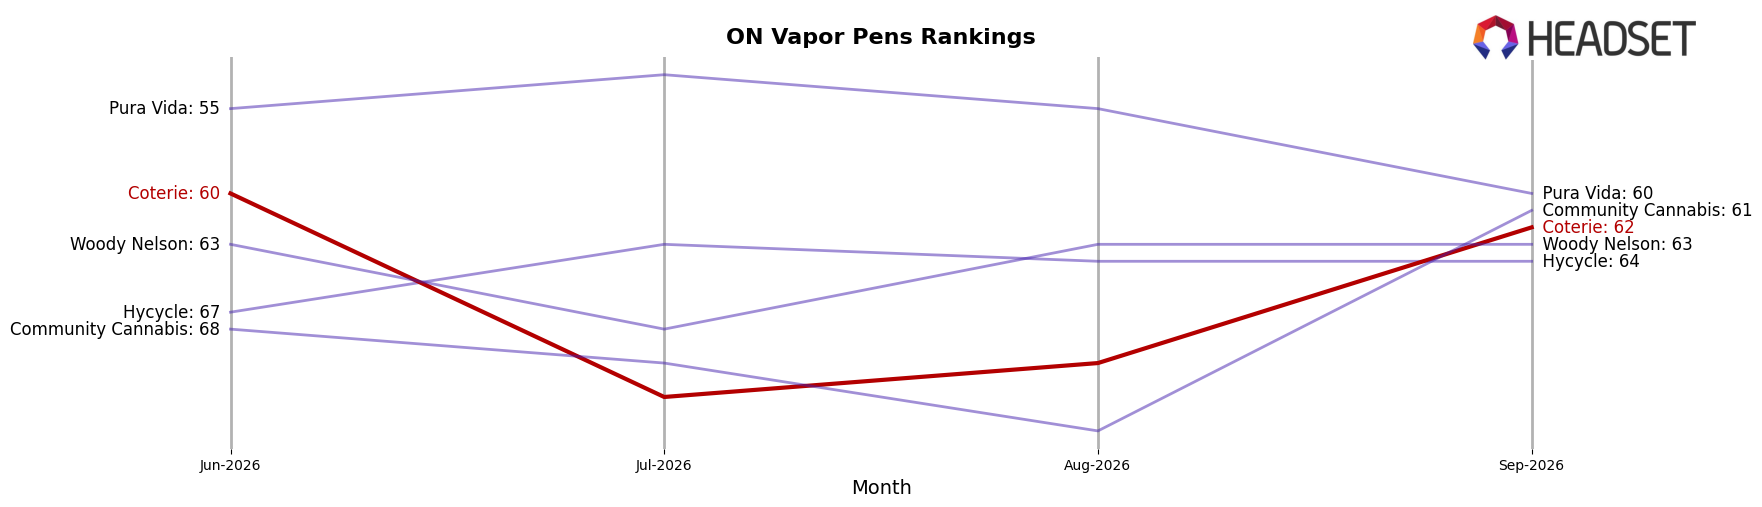
Coterie sits at rank #62 in September 2026, slipping 4 positions year over year from #58 and down 2 spots from June 2026’s #60, while its historical peak of #45 in August 2025 is now 17 places higher than the current mark; by contrast, Spinach advanced from #4 to #1 alongside a 172.5% YoY sales increase and Kolab moved from #14 to #5 with a 93.0% YoY lift, indicating that competitors are gaining rank faster than Coterie is retaining it, which implies Coterie’s trajectory points to eroding share-of-rank unless it re-enters the top-50 corridor it last touched in August 2025.
Notable Products
The steepest movement in September 2026 was a -64.1% month-over-month drop for Fruity Pebbles Live Resin Infused Blunt (1g), which slid to rank 3 while Lemon Cherry Gelato Pre-Roll 4-Pack (2g) also fell -20.1% at rank 4; taken together with Strawberry Gary Pre-Roll 3-Pack (1.5g) at -23.0% and rank 7, this points to pressure within infused and multi-pack pre-rolls that is reshaping category mix away from legacy formats. Offsetting that, Prickly Pear Liquid Diamonds Cartridge (1g) jumped 77.4% to rank 6 and Double Mango Liquid Diamonds Disposable (1g) rose 38.6% to rank 2, while Platinum Pressed Hash (2g) gained 41.2% at rank 5; with four of the top ten being Pre-Roll SKUs but the fastest movers in Vapor Pens and Concentrates, the pattern implies a pivot toward higher-potency, tech-forward formats likely to drive assortment and marketing toward liquid diamonds and hash offerings.
Top Selling Cannabis Brands






Data for this report comes from real-time sales reporting by participating cannabis retailers via their point-of-sale systems, which are linked up with Headset’s business intelligence software. Headset’s data is very reliable, as it comes digitally direct from our partner retailers. However, the potential does exist for misreporting in the instance of duplicates, incorrectly classified products, inaccurate entry of products into point-of-sale systems, or even simple human error at the point of purchase. Thus, there is a slight margin of error to consider. Brands listed on this page are ranked in the top twenty within the market and product category by total retail sales volume.

