.svg)
Aug-2026
Sales
Trend
6-Month
Product Count
SKUs
Avg Price
YoY Sales Change
YoY Price Change


Market Insights Snapshot
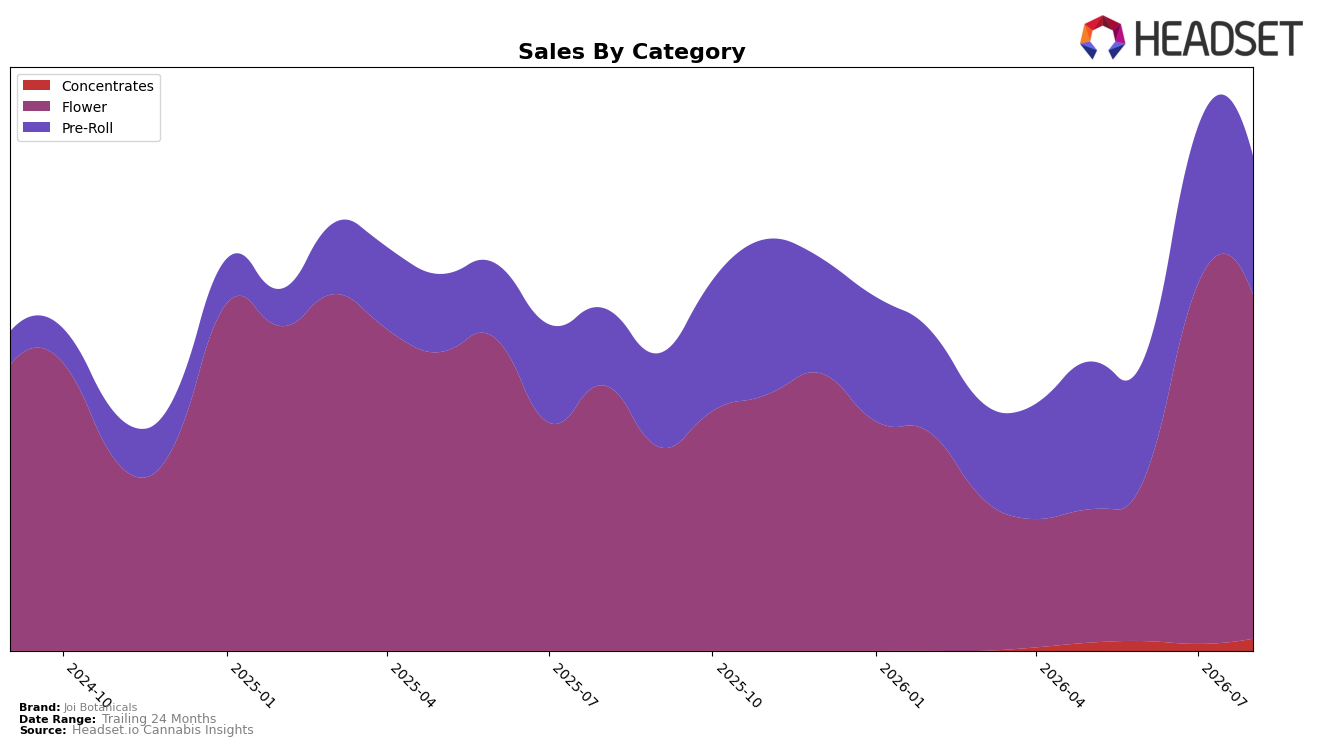
In August 2026, Joi Botanicals concentrated 69.46% of sales in Flower with year-over-year growth of 29.47% but a month-over-month decline of 4.57%, while Pre-Roll held 28.06% share with 80.33% YoY growth and an 11.60% MoM pullback; Concentrates was 2.48% of mix with a 74.47% MoM surge and no YoY baseline. Average price rose 19.50% YoY to one allowable dollar figure of $41.49, contrasting with Flower’s higher $55.07 and Pre-Roll’s $25.18 price points; the brand’s overall sales advanced 44.48% YoY even as Pre-Roll and Flower both declined MoM. The pattern implies demand is expanding year over year on the back of Pre-Roll and Flower, but August mix pressure from MoM declines in the two largest categories increases reliance on a small, fast-rising Concentrates niche.
With Flower ranked 68th in British Columbia and accounting for 69.46% of sales, the 4.57% MoM dip alongside an 11.60% MoM decline in 28.06%-share Pre-Roll signals near-term velocity risk if these two pillars soften together; however, the 74.47% MoM lift in 2.48%-share Concentrates provides an entry point to premium shoppers at a $72.40 price tier. The 19.50% YoY rise in average price alongside 80.33% YoY growth in Pre-Roll suggests price tolerance in value-oriented formats while Flower’s 29.47% YoY indicates steadier, higher-ticket turns; together, this implies positioning headroom to tier assortment, using Concentrates as a margin anchor and Pre-Roll as a traffic driver while defending Flower share to address the rank of 68.
Competitive Landscape
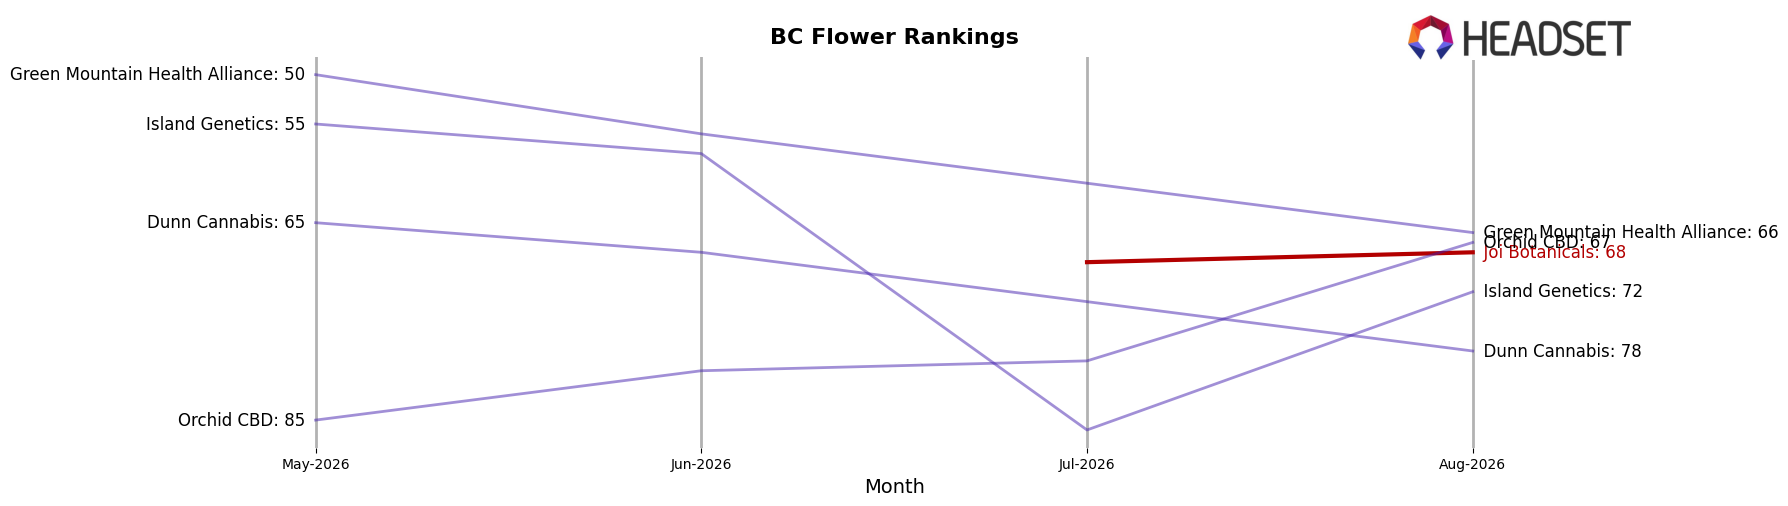
Joi Botanicals sits at rank #68 in BC Flower in August 2026, with its peak rank also #68 in August 2026, indicating no upward change from prior months and no available year-over-year rank delta to offset this baseline. In contrast, Big Bag O' Buds held #1 and stayed flat year over year at #1 while posting a 33.8% YoY sales increase, and Spinach climbed from #4 to #2 alongside a 54.2% YoY sales gain; Good Supply moved from #6 to #3 with 91.8% YoY growth, marking upward mobility that contrasts with Joi Botanicals’ static peak at #68. The pattern implies Joi Botanicals is anchored in the lower tier while leading competitors consolidate share through rank gains, so absent a shift in distribution or velocity, the brand risks entrenchment below the top 50.
Notable Products
Super Lemon Haze Pre-Roll 7-Pack (3.5g) posted the largest month-over-month gain at 65.7% and climbed to rank 6 in August 2026, while CBD Super Lemon Haze Pre-Roll 10-Pack (3.5g) also surged 60.1% to rank 3. In contrast, Orange Kush Cake (7g) fell 44.4% to rank 1 by units among top products but lost momentum against rising pre-rolls, and Mojito Cookies Pre-Roll 7-Pack (3.5g) declined 41.9% to rank 4. Four of the top ten are Pre-Roll SKUs, and Super Lemon Haze variants span both Flower and Pre-Roll, indicating the brand is consolidating demand around value multi-pack formats rather than larger Flower sizes.
Top Selling Cannabis Brands






Data for this report comes from real-time sales reporting by participating cannabis retailers via their point-of-sale systems, which are linked up with Headset’s business intelligence software. Headset’s data is very reliable, as it comes digitally direct from our partner retailers. However, the potential does exist for misreporting in the instance of duplicates, incorrectly classified products, inaccurate entry of products into point-of-sale systems, or even simple human error at the point of purchase. Thus, there is a slight margin of error to consider. Brands listed on this page are ranked in the top twenty within the market and product category by total retail sales volume.

